How to Measure Project Success Effectively

To really measure if a project was successful, you have to look past the old-school metrics of just finishing on time and staying within budget. True success is about the project's actual business value, how happy your stakeholders are, and whether it lined up with the company's bigger goals. Ticking these boxes gives you a complete picture of its real-world impact.
Defining Success Beyond the Iron Triangle
For decades, project management was boxed in by the "iron triangle." This rigid framework said a project was a success if it delivered on time, within budget, and to the original scope. While those things are definitely still important, clinging to them as your only measures of success is a recipe for missing the bigger picture.
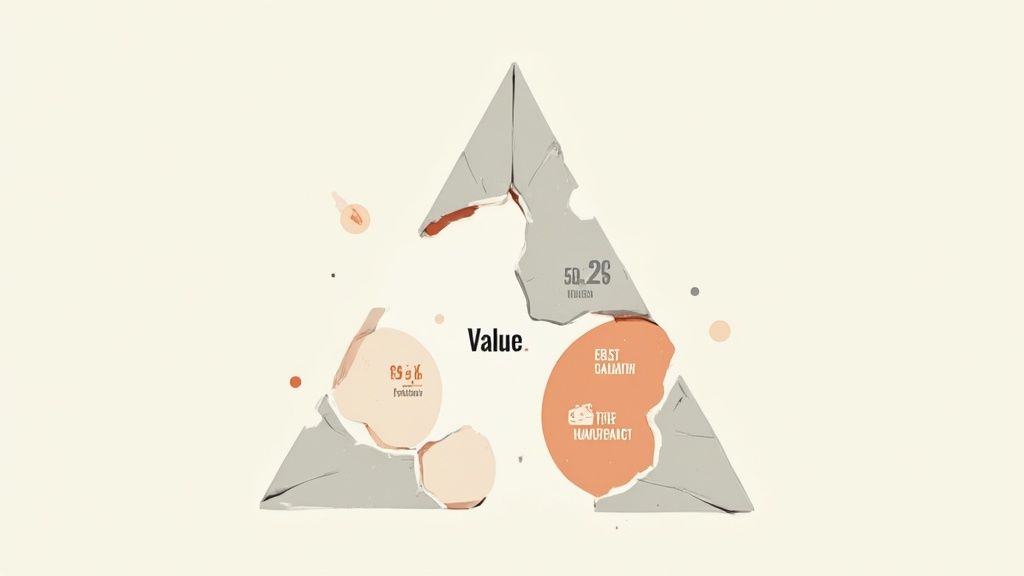
Think about it. What good is a project that hits all three targets but delivers zero tangible business value? Or one that comes in under budget but leaves the people who have to use it frustrated and unwilling to adopt the final product? These scenarios happen all the time, and they perfectly illustrate why the traditional model just doesn't cut it anymore.
Moving from Outputs to Outcomes
Modern project management is all about shifting your perspective from outputs to outcomes. An output is the thing you deliver—the product, the service, the new feature. An outcome is the real-world benefit that output creates.
Here’s a classic example: a software team ships a brand-new CRM system (the output) right on schedule. But if the sales team finds it clunky and goes out of its way to avoid using it, the project failed to achieve its intended outcome of boosting sales efficiency. It was a technical success but a total business failure.
The most important mental shift is moving from asking, "Did we build it right?" to "Did we build the right thing?" This question forces you to focus on genuine value and impact, not just checking boxes on a process sheet.
The Real Pillars of Modern Project Success
A more complete definition of success looks at several dimensions that reflect a project's true contribution. These pillars give you a much more balanced view, ensuring you're not just completing tasks but actually making a difference.
Before we dive into the nitty-gritty, let's get a high-level view of what truly matters today.
The Dimensions of Modern Project Success
A quick look at the core pillars for evaluating a project's true impact, moving beyond just budget and timeline.
| Success Dimension | What It Measures | Example Metric |
|---|---|---|
| Business Value | The direct financial or strategic benefit to the organization. | Increased revenue by 15%, reduced operational costs by 20%. |
| Stakeholder Satisfaction | How happy clients, end-users, and internal teams are with the result. | Net Promoter Score (NPS) of +50, positive feedback survey results. |
| Strategic Alignment | The project's contribution to broader company goals. | Contributed to the Q3 objective of "market expansion." |
| Team Health | The well-being and morale of the project team. | Low team turnover, positive post-project retrospective feedback. |
| Quality | How well the final deliverable performs its intended function. | Number of critical bugs post-launch, system uptime percentage. |
This holistic approach, covering everything from financial returns to team morale, is what separates good project management from great project management.
The Numbers Behind the Challenge
Even hitting the old-school targets is tough. Global stats show that only about 35% of projects are successfully delivered on time, within budget, and to scope. The data also reveals something interesting: organizations with mature project management practices have a success rate 28% higher than those without. It’s clear that having a structured, modern approach really pays off.
Ultimately, a smart project profitability analysis is key to seeing the whole story. A project that goes slightly over budget to capture a new market segment could be far more "successful" than one that saves a little cash but delivers something nobody wants. True success is all about the lasting impact on the business.
Selecting KPIs That Actually Matter
Once you've broadened your definition of success, the next challenge is picking the right things to measure. It’s incredibly easy to get lost in a sea of data, tracking dozens of metrics that look impressive on a dashboard but don’t actually tell you if you're winning.
The real trick is to choose Key Performance Indicators (KPIs) that connect directly back to your project’s core purpose. This means getting past vanity metrics—like the number of features shipped—and digging into what actually drives value for the business. A huge part of this is knowing the difference between two kinds of indicators: lagging and leading.
The Power of Leading vs. Lagging Indicators
Most of us are comfortable with lagging indicators. These are the metrics you look at after the fact to see what already happened.
- Budget Variance: Did we spend more or less than we planned?
- Schedule Variance: Are we ahead of or behind our timeline?
- Defect Count: How many bugs popped up after we launched?
These are absolutely essential for reporting and holding ourselves accountable, but they're fundamentally reactive. By the time a lagging indicator flashes red, the problem has already hit.
On the flip side, leading indicators are predictive. They give you clues about what’s likely to happen down the road, so you can be proactive and make course corrections before you veer off a cliff. They often focus on the processes and behaviors that lead to the final result.
Think of it like driving a car. Lagging indicators are like looking in the rearview mirror to see where you've been. Leading indicators are like looking through the windshield to see what's coming up. You need both to get where you're going safely.
Building a Balanced Scorecard of KPIs
To really get the full picture of project success, you need a mix of KPIs that tell a complete story. Fixating on just one area, like cost, will inevitably create blind spots. A much better approach is to build a balanced scorecard that covers a few critical domains.
Efficiency KPIs
These metrics are all about how well you're using your resources—time, money, and people. They’re the closest link to the traditional "iron triangle" and are still vital for keeping the project's operational health in check.
- Cost Performance Index (CPI): This is a classic for measuring the financial efficiency of a project. If your CPI is greater than 1, you’re under budget. If it's less than 1, you're over. Simple as that.
- Cycle Time: For agile teams, this is gold. It’s the average time it takes to move a single piece of work from "in-progress" to "done." A consistently decreasing cycle time is a great sign of improving efficiency.
Quality KPIs
Quality metrics are there to make sure the thing you’re building actually works and doesn't frustrate your users. After all, any gains you make in speed and cost can be wiped out in an instant by poor quality.
- Customer Satisfaction (CSAT) Score: This is a direct pulse check on how happy users are with what you've delivered, usually gathered through quick, simple surveys.
- Number of Change Requests: If you see a flood of change requests right after a feature is marked "done," it's a huge red flag. It often means the initial requirements weren’t properly understood or the execution missed the mark.
Business Value KPIs
This is where the rubber meets the road. These KPIs connect your project's work directly to the organization's bigger strategic goals and, ultimately, its bottom line. A great way to align these is with a framework like Objectives and Key Results (OKRs). If you want to dive deeper, you can master Objectives and Key Results to skyrocket business success and apply those same principles here.
- Return on Investment (ROI): The ultimate measure of financial success, calculated as (Net Profit / Total Investment) x 100. It answers the big question: Was this project worth the money?
- Adoption Rate: This shows how many people are actively using the new feature or system you built. A brilliant product that nobody uses delivers exactly zero value.
Team Health KPIs
Never underestimate this one. A burnt-out, disengaged team is a massive leading indicator of future trouble, from missed deadlines to shoddy work.
- Team Velocity: In the agile world, this tracks the amount of work a team can realistically get done in a sprint. A stable or gradually increasing velocity is a fantastic sign of a healthy, high-performing team.
- Employee Engagement Score: Usually measured with anonymous surveys, this gives you powerful insight into team morale, motivation, and overall well-being.
By choosing a few solid KPIs from each of these categories, you get a much more holistic and honest view of your project. This balanced approach ensures you’re not just shipping on time, but delivering the right thing in a way that’s sustainable and truly moves the needle for the business.
Building Your Project Measurement Framework
Knowing which KPIs to track is a great start, but those metrics are just numbers without a solid system to collect, analyze, and act on the data. This is where a project measurement framework comes in. Think of it as your project's nervous system—it translates raw data into clear signals about its health and direction.
The absolute foundation of any good framework is setting clear baselines before the project even kicks off. Without a baseline, you're measuring against thin air. It’s like trying to figure out if you're driving faster without knowing your starting speed. The data you gather just won't have the context it needs to be useful.
Establishing Baselines and Setting Targets
Before day one, you have to document the "before" state. If your project is about improving customer support efficiency, your baseline might be the current average ticket resolution time. For a website redesign, it could be the existing conversion rate. This initial snapshot is non-negotiable; it's the yardstick you'll use to measure every bit of progress.
Once that baseline is locked in, you can set realistic targets. A target is your ultimate goal (e.g., cut ticket resolution time by 20%), while a threshold is the acceptable performance range. For instance, a budget variance of +/- 5% might be perfectly fine (green), but anything between 6-10% is a warning sign (yellow), and over 10% is a critical alert (red).
This whole process of building a strong KPI foundation can really be boiled down into three core actions.
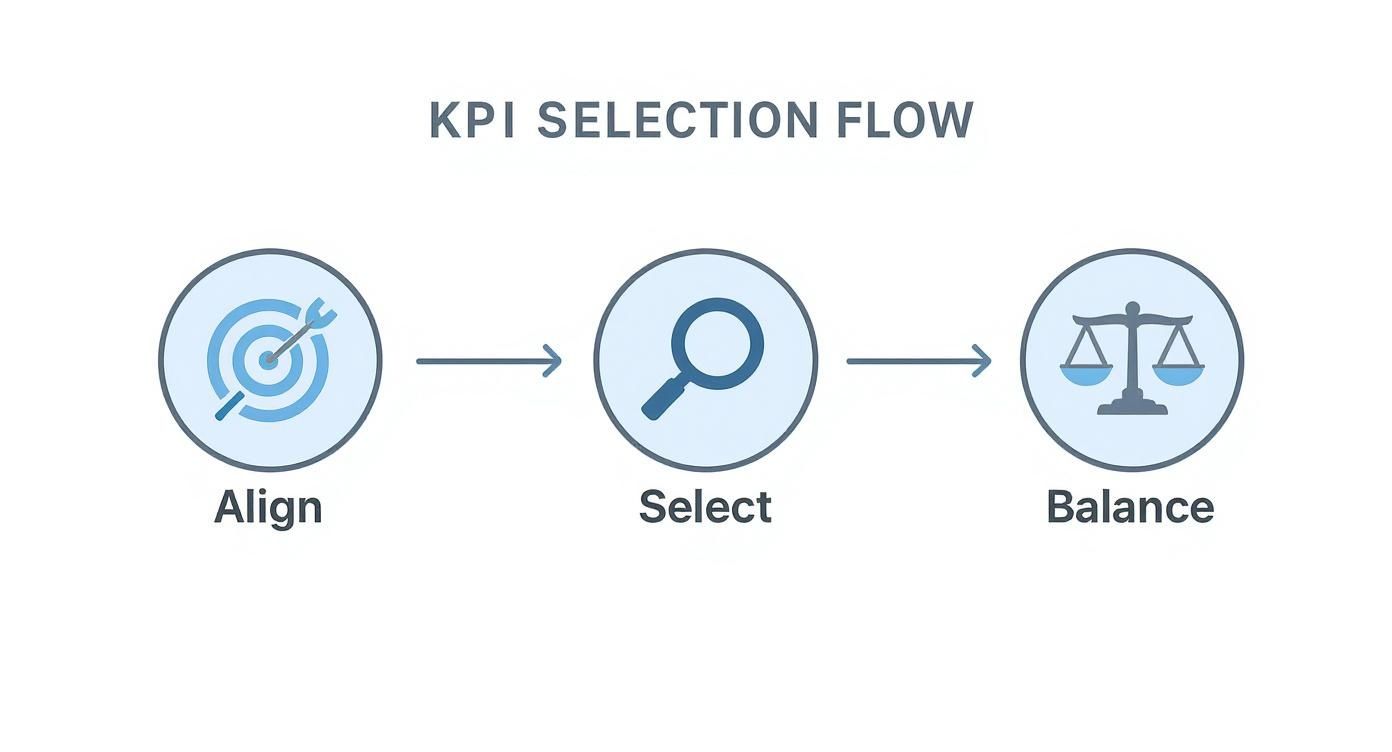
This flow really drives home that success starts with aligning your KPIs to actual goals, carefully selecting the right metrics, and then balancing them out to get a complete picture.
Choosing Your Data Collection Methods
With targets in place, you need a plan for actually gathering the data. The method you pick will depend on the metric's complexity and your team's resources. The most important thing is to prioritize accuracy and consistency, no matter what.
- Manual Check-ins: These are perfect for qualitative data like stakeholder satisfaction or team morale. Simple surveys or structured chats during weekly meetings can offer insights you can't get from a spreadsheet.
- Spreadsheets: A step up from manual notes, shared spreadsheets are great for keeping tabs on simpler quantitative metrics like bug counts or task completion rates.
- Automated Tools: For metrics like budget adherence, time tracking, or lead generation, automated project management and productivity tools are a must. They cut out human error and give you real-time data without making your team do extra work.
Interestingly, the principles behind a good project measurement framework are a lot like those for building a competitor analysis framework. Both rely on systematic data gathering and sharp analysis to make smart, strategic decisions.
A Framework in Action: Marketing Campaign Launch
Let's make this real. Imagine you're launching a new digital marketing campaign. Here’s what your framework might look like:
-
Define KPIs and Baselines:
- Business Value KPI: Lead Generation. Baseline: 50 leads/month from past efforts. Target: 80 leads/month (a 60% increase).
- Efficiency KPI: Budget Adherence. Baseline: N/A (it's a new project). Target: Stay within +/- 5% of the $20,000 budget.
-
Select Data Collection Tools:
- Lead Generation: This would be tracked automatically through your marketing platform (like HubSpot), which counts every form submission on the campaign's landing page.
- Budget Adherence: Monitored using a project management tool where every single campaign expense is logged against the budget.
-
Set a Reporting Cadence:
- The project manager keeps an eye on a real-time dashboard daily.
- A formal report summarizing lead count and budget variance goes out to stakeholders every Friday.
This kind of structured approach turns the vague idea of "success" into a concrete, measurable, and manageable process. In fact, organizations that use formal project management practices see 73% of their projects meet original goals, a big jump from the 58% for those winging it.
A key piece of this puzzle is a clear understanding of https://deskcove.com/what-is-performance-measurement/ and how it connects the team's daily activities to the big-picture strategic outcomes.
Turning Raw Data into Actionable Insights
Collecting data is one thing; knowing what to do with it is where the real magic happens. Piles of raw metrics sitting in a spreadsheet don't tell you much about how your project is actually doing. The real challenge is turning those numbers into a clear story—a process that can save a project from going completely off the rails.
The goal here is to move past simply reporting numbers and start digging into what they mean. This means hunting for trends, spotting strange outliers, and constantly asking "why" to get to the root of what the data is telling you.
From Numbers to Narratives
Your data needs to tell a compelling story. Instead of just stating that "budget variance is at +7%," a much more useful narrative is, "We're currently 7% over budget, mainly because the design phase needed more overtime than we planned. We expect to balance this out as we head into development, which is already tracking ahead of schedule."
This simple shift gives stakeholders context, helps manage their expectations, and shows you're on top of things. The problem is, it's tough to build these narratives when you're flying blind. It's a massive issue that 55% of organizations don't have access to real-time KPIs, which makes it nearly impossible to intervene effectively. This gets even worse when project goals are fuzzy from the start, which is why 37% of project failures are blamed on poorly defined objectives.
The same principles discussed in unlocking success through analytics in HR apply directly to project management—using data to make smarter, evidence-based decisions is key.
Mastering Quantitative Performance Metrics
To really get a grip on performance, you need a few key quantitative metrics that offer a quick snapshot of efficiency. Two of the most powerful are the Cost Performance Index (CPI) and the Schedule Performance Index (SPI).
- Cost Performance Index (CPI): This is all about budget efficiency. If your CPI is over 1.0, you're under budget (which is great). If it drops below 1.0, you're spending more than you planned.
- Schedule Performance Index (SPI): This tells you how you're doing against the timeline. An SPI greater than 1.0 means you're ahead of schedule, while anything less than 1.0 means you're falling behind.
Real-World Example: Let's say your project has a $50,000 budget and you're about halfway through. You've already spent $30,000. Your CPI would be less than 1.0, flagging that you're on track to blow the budget. This insight gives you a chance to course-correct now, not when the money has already run out.
Gauging the Human Element: Stakeholder Satisfaction
Numbers only tell part of the story. A project can hit every deadline and stay under budget but still be a total failure if the stakeholders—your clients, users, or even internal teams—are unhappy. Measuring their satisfaction is a critical, and often forgotten, piece of the puzzle.
You can gather this qualitative feedback in a few ways:
- Surveys: Tools like Net Promoter Score (NPS) or Customer Satisfaction (CSAT) surveys are perfect for getting a quick pulse on how people are feeling.
- One-on-One Feedback: Schedule some quick, informal chats with key stakeholders. Ask simple, open-ended questions like, "What's one thing we could be doing better?" The insights can be invaluable.
- Sentiment Analysis: If your team communicates a lot on platforms like Slack or in email chains, you can use tools to analyze the overall tone of the conversations to catch issues before they escalate.
When you mix this kind of qualitative feedback with your hard data, you get a true 360-degree view of your project's health.
Visualizing Success with Project Dashboards
Want to make your data easy for everyone to understand? Visualize it. A well-designed project dashboard can translate complex metrics into simple charts and graphs that anyone, from your team members to the CEO, can understand in a few seconds.
A great dashboard should highlight your most critical KPIs, often using simple color cues—like red, yellow, and green—to show status at a glance.
Here’s what a sample dashboard might look like:
| Metric Displayed | Visualization Used | What It Tells You at a Glance |
|---|---|---|
| Budget vs. Actual Spend | A bar chart comparing planned vs. actual costs over time. | If you are trending over or under your allocated budget. |
| Task Completion Rate | A "burndown" chart showing work completed vs. work remaining. | Your team's velocity and whether you're on track to meet deadlines. |
| Stakeholder Satisfaction | A simple gauge or dial showing the latest NPS or CSAT score. | The overall sentiment of your key stakeholders. |
By turning raw data into these clear, visual insights, you empower your entire team to make smarter decisions and keep the project moving toward true success.
Reporting on Success to Every Stakeholder
Pulling together all your project data is one thing. Actually communicating it is a whole different ball game. How you report on your findings is just as important as the performance itself—it’s what builds trust, manages expectations, and gets you the support you need for what comes next.
Effective reporting isn’t just about sending a data dump in an email. It’s about telling a story that resonates with your specific audience. A one-size-fits-all report rarely works because, frankly, no one reads it. Your communication has to shift depending on who’s on the receiving end.
Tailoring Your Message for Different Audiences
The secret to great reporting is knowing what each person really cares about. Your executive sponsor has completely different priorities than a developer deep in the code. Missing this simple distinction is a rookie mistake that can tank the perceived value of your hard work.
- For Executive Sponsors: They want the 30,000-foot view, fast. Stick to the bottom line: ROI, business impact, and how the project aligns with company goals. Dashboards and quick visuals are your best friends here.
- For Project Teams: This is where you get granular. Your team needs to see the day-to-day progress, what’s blocking them right now, and hard data on things like team velocity. This is the info they use to solve problems on the fly.
- For Clients or End-Users: They care about one thing: "How does this affect me?" Focus your updates on upcoming features, key delivery dates that will impact their workflow, and the real benefits they’re about to see.
When you tailor your updates like this, everyone gets exactly what they need in a way they can actually use. It makes your message stick.
Building a Narrative Around Your Data
The best project reports don’t just present numbers; they tell a story. You have to move beyond just the "what" and get to the "so what?" Your job is to give context, celebrate the wins, and be completely upfront about the challenges.
A solid report anticipates the questions before they’re even asked. If you’re behind schedule, don't just state the delay. Explain why it happened, what the real-world impact is, and the specific steps you’re taking to get back on course.
The most effective project updates build confidence. They show stakeholders not only where the project stands but also that a capable leader is navigating its course, prepared to handle both successes and setbacks with a clear plan of action.
This is even more critical when you consider that most projects fail to deliver on their initial promise. It's a shocking statistic, but only 36% of organizations say they consistently get the full value from their projects. This massive gap proves that just shipping the project isn’t enough. Your reporting has to connect the dots between what you delivered and the actual value it created. You can dig deeper into these kinds of project management insights and trends to see the bigger picture.
A Practical Template for Your Status Report
To keep your reporting consistent and punchy, a simple template is the way to go. It ensures you hit all the key points we've discussed without making people’s eyes glaze over.
Here’s a straightforward structure you can steal and adapt:
| Section | Content Focus | Target Audience |
|---|---|---|
| Executive Summary | A quick paragraph on project health, key wins, and major risks. | Executive Stakeholders |
| KPI Snapshot | A visual (Red/Yellow/Green) for Budget, Schedule, Scope, and Quality. | All Stakeholders |
| Recent Wins | A bulleted list of major milestones hit since the last update. | Project Team, All |
| What's Next | A clear look at the team's next focus areas with target completion dates. | Project Team, Clients |
| Risks & Issues | A transparent view of current roadblocks and your plan to tackle each one. | Executives, Project Team |
This structure keeps every report sharp and to the point. It gives leadership the high-level summary they need while providing the team on the ground with actionable details. When you master how you report on project success, you stop being just a task manager and become a strategic leader who communicates real value.
Got Questions About Measuring Project Success? You're Not Alone.
Even with the perfect framework and a shiny new set of KPIs, putting a success measurement strategy into practice is where the real work begins. Moving from paper to the real world always brings up tricky questions. Honestly, navigating these complexities is what separates a plan that looks good from one that actually works.
Let's dive into some of the most common challenges I've seen project managers run into. These aren't theoretical problems; they're the practical hurdles you'll face, from confusing data to stakeholders who just won't budge. My goal is to give you some clear, battle-tested advice so you can handle them with confidence.
What Should I Do When Metrics Tell Conflicting Stories?
Ah, the classic scenario. Your budget tracking shows you're well in the green (a beautiful CPI), but your stakeholder satisfaction surveys are taking a nosedive. Don't panic. This isn't a sign that your system is broken; it’s a bright, flashing signal telling you to dig deeper.
When your metrics clash, it almost always points to a trade-off you didn't see coming. Maybe you’re hitting those budget targets because you quietly cut corners on user training, which is now leading to widespread frustration. The key is to bring these conflicting data points to the table and start a conversation.
- Don't ignore the conflict. Treat it as a critical insight, not a fluke in the data.
- Investigate the "why." Get on the phone or grab a coffee with your team and stakeholders. Ask direct questions like, "We're saving money, which is great, but I'm hearing some frustration. What's the connection I'm missing?"
- Rebalance your priorities. This might be the moment you consciously decide to invest more in quality or user experience, even if it means adjusting another metric’s target.
This is exactly why having a balanced set of KPIs is so important. If you were only looking at the budget, you would've been blindsided by a brewing disaster.
How Does Measurement Differ for Agile vs. Waterfall Projects?
While the core principles of measuring success—like delivering business value and keeping stakeholders happy—are universal, how and when you measure things can look very different depending on your methodology.
Waterfall projects are all about the big milestones. You set a detailed plan upfront and then meticulously track how much you deviate from it. This is where metrics like the Schedule Performance Index (SPI) and Cost Performance Index (CPI) really shine, as they're built to measure progress against a fixed baseline.
Agile projects, on the other hand, are a different beast entirely. They're all about iterative progress and adapting on the fly. Measurement happens in short, frequent cycles, usually at the end of each sprint.
With Agile, the fundamental question shifts from "Are we on plan?" to "Are we delivering value continuously and learning from feedback?" Metrics like team velocity, cycle time, and direct customer feedback become far more valuable than sticking to a six-month-old Gantt chart.
The methodology you choose really matters. For instance, Agile projects tend to see success rates around 64%, which is a significant jump from the 49% for traditional Waterfall methods. This just goes to show how powerful adaptive approaches can be in today's world. You can dig into more of these worldwide project management insights to see how different frameworks shape project outcomes.
How Can I Get Buy-In From Stakeholders Focused Only on Time and Budget?
This is probably the most common—and toughest—challenge of them all. Many senior leaders came up through the ranks seeing projects purely through the lens of the iron triangle (time, budget, scope). To get their buy-in for a more holistic view of success, you have to connect your new metrics back to the two things they care about most: risk and money.
Don't try to replace their beloved budget and schedule metrics. Instead, frame your new KPIs as essential leading indicators that protect those very things.
| If a Stakeholder Cares About… | Frame Your New KPI as… | Your Pitch |
|---|---|---|
| Budget | A Risk Mitigation Tool. | "By tracking team morale, we can spot burnout before it leads to costly mistakes and turnover, protecting our budget in the long run." |
| Timeline | A Predictor of Delays. | "That low user adoption rate on our beta is an early warning. If we don't fix this now, we're looking at major rework and delays after launch." |
| ROI | A Driver of Value. | "Focusing on customer satisfaction ensures we build a product people will actually use and pay for, which directly drives our return on investment." |
When you frame your broader metrics as tools to safeguard their primary concerns, the conversation changes. It's no longer an "either/or" debate but a collaborative effort to ensure success on every front. This helps them see the bigger picture without feeling like you're ignoring their core priorities.
Ready to get crystal-clear visibility into your team's efficiency and project timelines? DeskCove gives you the real-time data and productivity insights you need to measure what truly matters. From automated time tracking to in-depth reporting, our tool helps you connect daily activities to successful project outcomes. Find out how DeskCove can help your projects succeed.