How To Calculate Hourly Rate With Real-World Examples

Quick Guide To Calculating Hourly Rate
Tired of guessing what to charge? Here’s a straightforward way to turn any salary into an hourly figure: Hourly Rate = (Monthly Salary × 12) / (Annual Working Hours). With this at your fingertips, you’ll avoid undercharging and start every conversation with confidence.
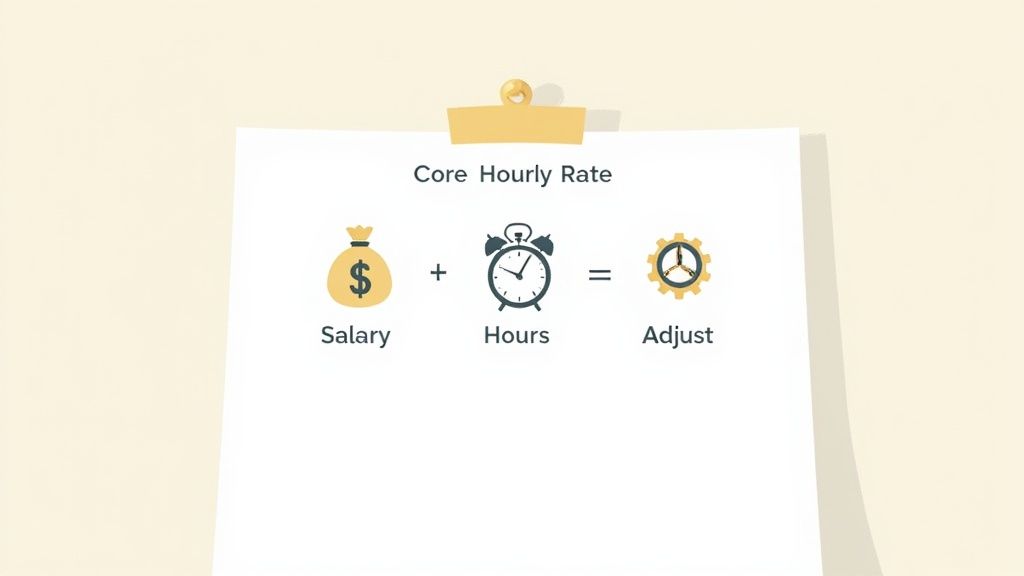
- Monthly Salary: Your gross pay before deductions.
- Annual Working Hours: Total hours worked per week × 52.
- Hourly Rate: The number you’ll ultimately invoice.
Why This Matters
Grounding your rate in a clear formula removes the guesswork. Clients appreciate transparency, and you’ll cover every expense—from taxes to the occasional sick day.
Plus, each part of the calculation can be tweaked based on location, role, or business model. Whether you’re a freelancer, contractor or part of an agency team, this method adapts.
To see how dramatic the differences can be, plug in global minimum wages. Luxembourg’s €2,704 monthly floor equates to about €15.60 per hour (roughly $15.43 USD). Meanwhile, Bulgaria sits at €3.18 per hour on a €551 salary—over a 380% gap within Europe alone. For a deeper dive into global minimum wage rankings, check out the data on World Population Review.
Before you finalize your numbers, automate the grunt work with our guide to timesheet Excel formulas.
Hourly Rate Formula Summary
Below is a quick snapshot of how the formula plays out with two real-world examples.
| Monthly Salary | Annual Working Hours | Hourly Rate |
|---|---|---|
| €2,704 | 2,080 | €15.60 |
| €551 | 2,080 | €3.18 |
This table makes it easy to see the gap at a glance—and why you should set your own rate thoughtfully.
Practical Tip
Always round your rate up slightly to accommodate untracked time, administrative tasks, and unexpected expenses.
Failing to adjust for holidays, vacations, or phone calls can leave you billing below your cost of doing business.
Charge what you deserve—every single hour.
Key Concepts For Calculating Hourly Rate
Figuring out what to charge isn’t just about picking a number and hoping for the best. You need a clear handle on billable hours, utilization rate, overhead costs, profit margin, and your tax obligations. Without these, hidden expenses sneak in and eat away at your bottom line.
A “40-hour workweek” looks great on paper, but once you factor in vacation, meetings, and admin work, you’re rarely billing the full block.
- Billable Hours: The actual client-facing time you can invoice.
- Utilization Rate: The percentage of your available hours you turn into billable work.
- Overhead Costs: Rent, software licenses, equipment, insurance, and other non-billable necessities.
- Profit Margin: The cushion above your costs to reinvest or weather slow periods.
- Tax Obligations: Everything from self-employment tax to payroll contributions, which vary widely by location.
Ignoring those few weeks of vacation can leave you billing closer to 1,800 hours rather than 2,080, shrinking your income projection by over 13%.
“Master these core terms first to avoid undercharging disasters down the road.”
Tracking Historical Wage Shifts
Looking back can shine a light on how simple tweaks kept pace with changing economies. Between 2015 and 2025, EU minimum wages jumped at very different speeds—Romania averaged about 14.1% growth each year, while Germany’s emerging wage shot up 63% to €13.90/hour.
For a deeper dive into how various countries handle minimum wage updates, check out Wikipedia.
Applying The Concepts
When vacation, sick days, or training sessions end up in your overhead, it’s easy to lose sight of the real numbers. Start by listing every non-billable category, then fit each into your rate calculation so nothing gets guessed.
Begin with your gross income target and break it down into the billable hours you expect:
- Gross Income Needs: Combine your target salary with estimated taxes.
- Billable Hours Estimate: Multiply your weekly work hours by 52, then subtract vacation and admin blocks.
- Rate Buffer: Add at least 10% to cover unexpected costs and ensure profit.
Aiming for about a 75% utilization rate helps balance time off and non-client work. This approach guarantees your rate covers each corner of your business—from invoices to rainy-day reserves.
Revisit these figures every year to stay in sync with market shifts. Keeping these fundamentals front and center means you’ll craft rates that are transparent for clients and solid for your business.
In the next section, we’ll walk through real-world examples with live numbers and a summary table.
Calculating Rates For Freelancers Contractors And Teams
Every work arrangement—be it a lone freelancer, a contract specialist, a salaried employee or a full agency squad—needs its own way to arrive at an hourly rate. At its core, it starts with a simple formula:
Hourly Rate = Total Earnings / Billable Hours.
But numbers alone don’t tell the whole story. You need to layer in utilization, overhead, taxes and your margin to arrive at a rate that truly covers costs and rewards your effort.
Solo Designer Scenario
Take a freelance designer earning $60,000 annually. On paper, a 2,080-hour year breaks down like this:
- Base Calculation: $60,000 ÷ 2,080 = $28.85 per hour
However, few freelancers hit 100% utilization. If you bill 75% of your time (around 1,560 hours):
- Utilization Adjustment: $28.85 ÷ 0.75 ≈ $38.47 per hour
From here, tack on any project-specific fees—premium software licenses, rush surcharges or special materials—so you never eat those costs yourself.
“Getting your utilization assumptions right can mean thousands more in annual revenue.”
For tips on making every minute count, see our guide on time tracking for freelancers.
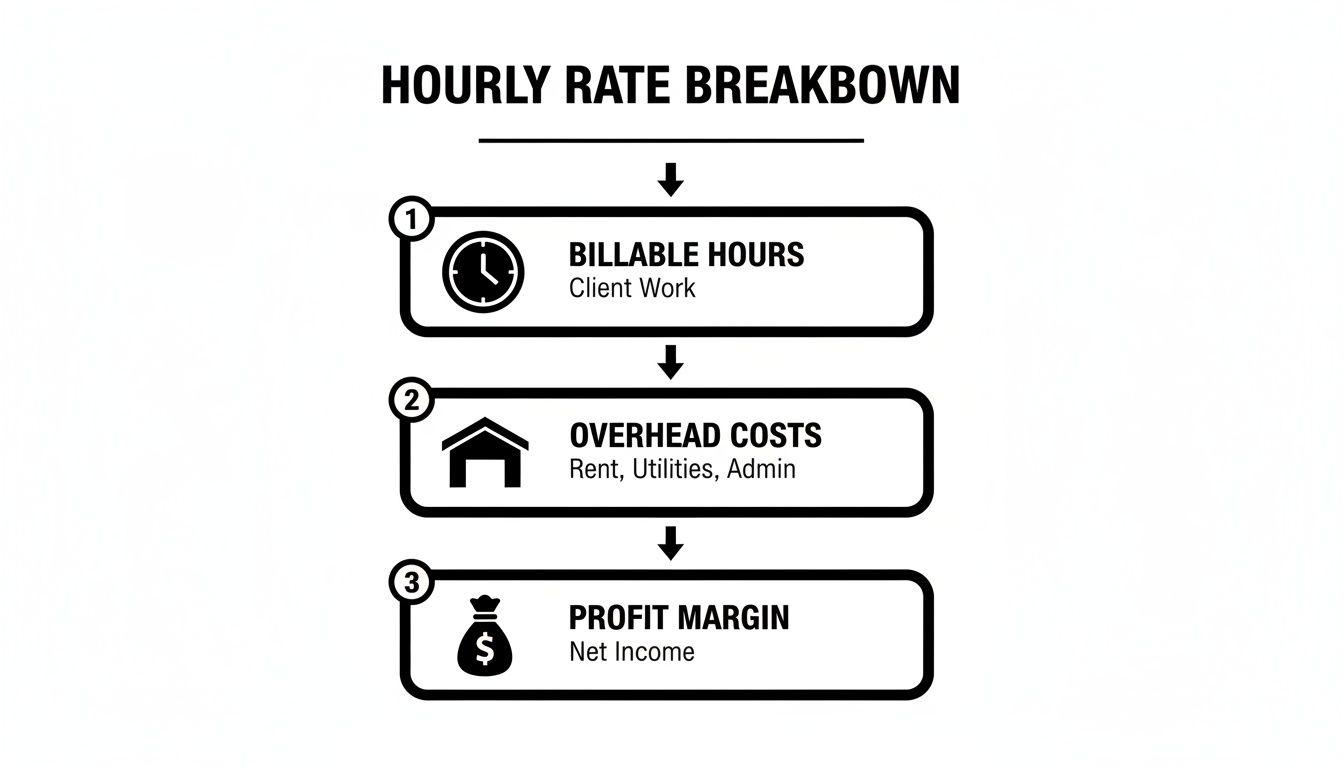
That visual walks you through combining billable hours, overhead and profit margins. In practice, you’ll often add 20%–40% on top of your base to cover all business costs.
Global Rate Differences
Rates vary wildly across regions. The same formula—Hourly Rate = Total Earnings / Billable Hours—reveals stark gaps:
- Ireland: €30.48 average vs. €13.96 minimum (a 118% premium)
- Canada: CAD 38.01 (≈ $28 USD) average versus $11.60–13.60 provincial lows
- United States: Federal floor at $7.25, while California’s minimum sits north of $16
These figures remind us that local markets and regulations shape what you can realistically charge.
Agency Team Allocation
Running an agency means spreading overhead over every billable hour. Suppose your annual overhead—rent, benefits and subscriptions—comes to $100,000. With five designers billing 1,600 hours each, you get 8,000 team hours:
- Overhead Rate: $100,000 ÷ 8,000 = $12.50 per hour
- Add Base Rate: $50.00
- Apply Profit Margin (20%):
- Combine Base + Overhead: $50.00 + $12.50 = $62.50
- Multiply by 1.20 = $75.00 per hour
“Underallocating overhead is a fast track to razor-thin margins.”
Comparison Of Rate Calculations By Work Arrangement
Before diving into new rates, take a moment to see how each formula stacks up.
Below is a quick reference table illustrating the calculation basis, formula and a sample rate for each scenario.
| Work Arrangement | Calculation Basis | Formula | Example Rate |
|---|---|---|---|
| Freelancer | Utilized Billable Time | Salary ÷ Potential Hours ÷ Utilization | $38.47 |
| Contractor | Project Hours | Total Fee ÷ Agreed Hours | $45.00 |
| Salaried Employee | Standard Work Year | Annual Salary ÷ 2,080 | $28.85 |
| Agency Team | Shared Overhead & Margin | (Base + Overhead) × (1 + Profit Margin) | $75.00 |
Use this snapshot to pick the right approach—whether you’re flying solo or coordinating a full roster.
Next Steps For Precision
It’s one thing to calculate your rate; it’s another to validate it:
- Pilot Your Rates On Real Proposals
- Track Actual Time With DeskCove Or A Similar Tool
- Note Any Scope Creep Or Unplanned Work
- Review Holidays, Sick Days & Non-Billable Activities
- Revisit And Adjust Rates Quarterly
- Communicate Fee Changes Clearly Up Front
“A small tweak in utilization or overhead assumptions can boost profits without losing clients.”
Personal Tips For Capturing Hidden Costs
Many freelancers forget routine costs like annual software renewals or occasional training. Treat them as part of your overhead—this simple move can lift your margin by 5%–10%.
- Audit Subscription Fees Monthly
- Log Non-Billable Tasks (emails, research, meetings)
- Break Down Overhead Into Discrete Line Items
By regularly comparing projected rates to actual revenue, you’ll spot gaps early and build a rate that truly reflects your expenses, market value and profit goals.
Adjusting Rates For Expenses And Profit
When you only count billable hours, you miss critical costs—and you miss out on profit. Your hourly rate needs to cover every expense and still leave room for growth. That means mapping out every operational cost before you settle on a number.
List All Operational Costs
Start by gathering your annual totals for each line item. Common expenses include:
- Rent for your studio, office, or coworking spot
- Subscription fees for design, accounting, or project-management tools
- Equipment costs (laptops, cameras) amortized over their useful life
- Insurance premiums and professional membership dues
- Internet, phone, utilities
Putting these figures into your rate worksheet reveals your true yearly overhead.
Many freelancers overlook small charges—those $10-a-month apps add up fast.
Calculate Required Profit Margin
A healthy profit margin cushions slow periods and fuels future projects. In creative businesses, aiming for 20%–30% profit is standard. Here’s how to apply it:
- Total your annual overhead
- Decide on a profit target (for example, 25% of overhead)
- Divide by your billable hours
Formula:
Final Rate = (Total Costs + Profit Target) ÷ Billable Hours
For instance, if you have $30,000 in costs, want a 25% margin, and expect to bill 1,500 hours:
($30,000 + $7,500) ÷ 1,500 = $25 per hour
Build Your Rate Worksheet
A quick-reference table keeps everything in view:
| Category | Annual Amount | Profit % | Profit Amount | Billable Hours | Final Rate |
|---|---|---|---|---|---|
| Overhead | $40,000 | 25% | $10,000 | 1,600 | $31.25 |
| Consultant Fee | $60,000 | n/a | n/a | 2,080 | $45.00 |
Update this worksheet quarterly—especially if your costs shift or your utilization changes.
Tip: Keep a seasonality log to spot slow months before they arrive.
Want more guidance on balancing overhead and profit? Check out our in-depth piece on Effective Strategies For Managing Overhead And Profit.
Implement And Review Your Rates
Once your rate is set, apply it to real project proposals and monitor the results. Track:
- Quotes sent versus projects won
- Actual hours billed against estimated hours
- Unbilled time spent on calls, admin, or revisions
Then compare your real profit to the target margin every quarter.
Regular rate audits ensure you’re not leaving money on the table.
This ongoing cycle—calculate, implement, review—creates a pricing strategy that scales with your business.
Manage Seasonality And Growth
Every freelancer and agency faces busy peaks and quiet valleys. Use your seasonality log to:
- Offer targeted discounts during off-peak periods
- Bump your rate by 10% when demand surges
- Bundle services with extras to keep revenue steady
A small buffer in your rate goes a long way toward covering lean months without cheapening your work. Revisit your costs, margins, and utilization each quarter so your rates always align with reality.
Using DeskCove Analytics To Refine Rates
Ever feel like you’re flying blind when setting your hourly fees? A deep dive into your DeskCove Analytics time data shines a light on the real story. By capturing every billable and non-billable minute, you move from guesswork to precision.
Key Metrics To Monitor
- Billable vs Non-billable Ratio: The share of hours you invoice versus internal or admin work.
- Utilization Rate: How much of your available time turns into client work.
- Project Profitability: Revenue earned compared to hours invested.
- Client Cost Distribution: The split between direct expenses and overhead per client.
- Task-Level Time Allocation: A breakdown of where your workday really goes.
Building Your Utilization Dashboard
First, tailor a new dashboard in DeskCove that puts time front and center. Drag in both billable and non-billable widgets for an instant side-by-side view.
Apply filters to zoom in on key periods:
- Set date ranges for busy seasons or slow quarters.
- Group data by client, project or team member.
- Tag entries like design or support to slice your hours further.
Here’s what that looks like in action.
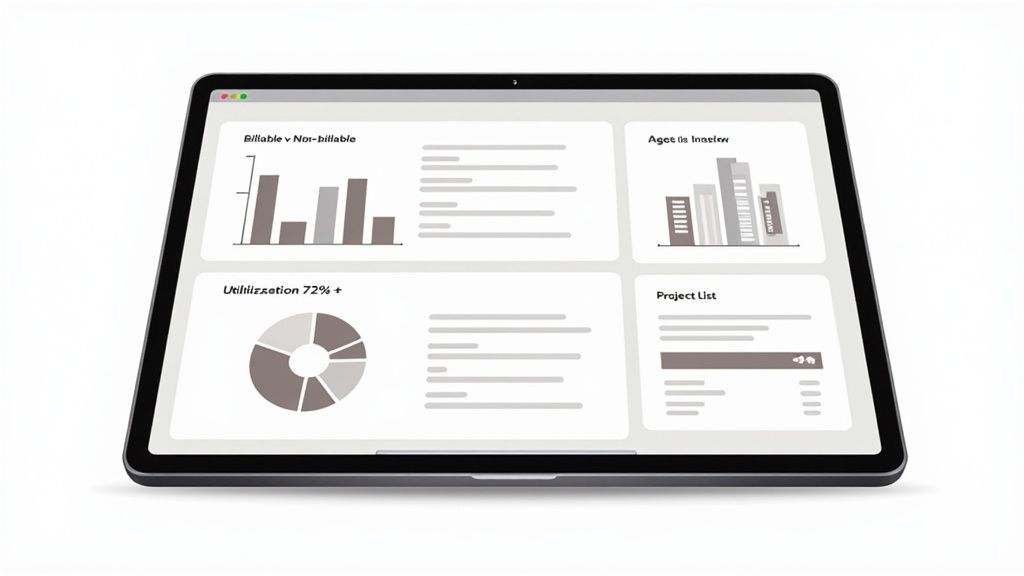
In this view, you can spot a 78% utilization rate and non-billable spikes during training weeks. Drill down week by week to see exactly when your focus shifts.
- Peak weeks often align with high-impact client work.
- Spikes in non-billable time signal workshops, onboarding or admin overload.
- Daily entries reveal who’s carrying the load or falling behind.
Spotting Underperforming Projects
Not every engagement hits your profit targets. Projects that drain resources can drag down your overall rate. To catch these early:
- Sort your projects by profit margin right in the dashboard.
- Highlight any below your comfort threshold (for example, 30%).
- Explore time entries to uncover scope creep or hidden admin tasks.
- Decide whether to bump up your rate, tighten the scope, or pause work.
This method shifts your rate-setting from theory to fact, using actual data points.
Setting Strategic Price Adjustments
Real insights let you tweak rates with confidence. Say one client’s work shows 15% non-billable time—boosting rates by 20% could restore your margins. You might also:
- Move low-margin tasks to flat-fee packages.
- Introduce an onboarding surcharge for heavy setup work.
- Offer tiered service levels so clients choose what fits their budget and your profitability goals.
“Using live time data cut my unprofitable projects in half within a month,” says freelance consultant Alex Morgan.
Pro Tips For Consistent Rate Reviews
- Automate quarterly reports in DeskCove for smooth check-ins.
- Compare actual billable hours against your forecasted utilization.
- Flag any rising trend in non-billable tasks.
- Tag repeat clients to monitor individual profitability.
- Refresh tags when you add new services or tools.
- Record the “why” behind each rate change to keep your team on the same page.
| Metric | Before Adjustment | After Adjustment |
|---|---|---|
| Utilization Rate | 65% | 85% |
| Profit Margin | 25% | 40% |
| Non-billable Time | 120 hrs/month | 60 hrs/month |
Integrating these dashboards into your pricing routine means your rates stay agile and fact-based. Next up: weaving these refined numbers into your client proposals for maximum impact.
Comparing Rate Scenarios
A side-by-side look makes the benefits clear. In DeskCove, a simple table can illustrate your gains at a glance:
| Scenario | Utilization | Rate ($/hr) | Profit Margin |
|---|---|---|---|
| Before Adjustment | 65% | 45.00 | 25% |
| After Data-Driven Update | 85% | 55.00 | 40% |
Notice the 10% jump in utilization, a $10 boost in your hourly rate, and a 15% lift in margins.
Next Steps For Implementation
Export your DeskCove data to CSV for deeper analysis in spreadsheets. Then sync it with your finance tools to automate monthly rate tweaks.
- Download raw time entries weekly to keep audits airtight.
- Map project tags to accounting codes for seamless invoicing.
- Build alerts that trigger if utilization dips below 70%.
Embedding DeskCove into your pricing workflow turns rate-setting into an informed, repeatable process.
Custom Alerts And Notifications
Real-time alerts mean you catch underbilling before it costs you.
- Notify yourself when any team member’s utilization falls under 60%.
- Ping project leads if non-billable time exceeds 25%.
- Schedule automatic reminders for your weekly report reviews.
This feedback loop locks in your ideal hourly rate baseline.
Case Study Agency Success
An eight-person agency audited 50 projects in DeskCove and found 18% of hours went to admin tasks—knocking utilization down to 66%.
- They cut redundant meetings and reclaimed 10% of billable time.
- A 12% rate increase on low-margin clients raised margins by 22% in two quarters.
Proof that solid data fuels smarter pricing.
Wrapping Up Your Analytics Workflow
These steps transform rate-setting from reactive guessing to proactive strategy. With DeskCove’s insights at your fingertips, you’ll close each month knowing your numbers—and your profits—are based on real performance.
Aligning Team Goals
Sharing your DeskCove dashboards creates accountability and drives better time management.
- Host monthly reviews to discuss utilization and rate impacts.
- Set personal utilization targets so everyone knows their benchmarks.
- Celebrate improvements with small rewards or public recognition.
This collaborative approach builds a data-driven culture and keeps your team aligned on hitting those ideal hourly rates.
Common Mistakes To Avoid When Setting Hourly Rate
Nailing down the right hourly rate is tricky. Miss just one ingredient and you’ll watch your earnings slip through the cracks.
Here are the five biggest traps I see time and again:
- Ignoring non-billable time and admin tasks
- Misestimating taxes and contributions
- Overlooking overhead and fixed expenses
- Basing rates on ideal capacity instead of reality
- Skipping regular rate reviews and adjustments
“The single biggest missed cost is unbilled admin work and holidays.”
Ignoring Non-Billable Time
It’s tempting to assume every minute can be billed. In practice, that rarely holds true. One freelance marketer logged 15 hours in client calls but only invoiced for 10, cutting revenue by 33%.
To fix this, start tracking:
- Emails and phone calls
- Prep work and research
- Internal meetings
Once you log every task in DeskCove, you’ll spot hidden gaps and know exactly what to invoice.
Misestimating Taxes
Forgetting to build taxes into your rate is a surefire way to end up underpaid. I once saw a contractor charge $50/hour, then realize too late that a 25% tax bill left them at $40 net.
Here’s the quick math:
- Decide your desired net hourly take-home
- Divide by (1 – tax rate)
- That result is your gross rate
For example, if you want $40 after tax at 25%, calculate $40 ÷ 0.75 = $53.33.
Overlooking Overhead
Those “small” costs add up: rent, software subscriptions, insurance. A boutique agency thought tools cost $20/hour—until real invoices showed $30. That extra $10 had quietly eaten into profits.
Break down your fixed and variable costs, then add a per-hour buffer:
- Rent and utilities
- Licenses and subscriptions
- Insurance and professional fees
Basing On Ideal Capacity
Using a 40-hour workweek sounds neat, but vacations, sick days, and slow periods happen. One consultant aimed for 2,080 billable hours but only hit 1,600, slashing revenue by 23%.
Instead, apply a 70%–80% utilization rate:
- Estimate realistic billable hours
- Factor in holidays and admin work
- Adjust your rate to cover the gap
Skipping Rate Reviews And Adjustments
Locking in a rate and forgetting it is like accepting pay cuts over time. I know a freelancer who stayed at $50/hour for three years—while living costs jumped 15%.
Make it routine:
- Schedule a calendar reminder each quarter
- Compare against inflation and market shifts
- Update rates and notify clients two weeks before changes take effect
Summary Of Mistakes
| Mistake | Instant Fix |
|---|---|
| Ignoring non-billable time | Log all tasks |
| Misestimating taxes | Gross-up rate |
| Overlooking overhead | Buffer costs |
| Basing On Ideal Capacity | Adjust for utilization |
| Skipping Rate Reviews And Adjustments | Audit quarterly |
Using DeskCove data makes spotting these pitfalls a breeze. Automate your time tracking, then:
- Review projects that deviate by 10%+
- Tag tasks for non-billable categories
- Communicate rate changes clearly
“A small update in your utilization assumption can boost earnings by thousands per year.”
Put these fixes into play and watch your bottom line thank you.
Frequently Asked Questions
What’s The Easiest Way To Adjust My Rate For Taxes?
Balancing the numbers to cover taxes shouldn’t feel like guesswork. Start by estimating your overall tax burden—federal, state, and self-employment combined. Then take your target net rate and divide it by (1 – your tax rate).
For instance, if you want to net $50/hr and expect to pay 30% in taxes, you’d calculate $50 ÷ 0.7, landing at about $72/hr for your gross rate.
How Do I Decide On A Utilization Rate Target?
Open your DeskCove dashboard and review the total billable hours recorded over the past quarter. Real-world data beats guesses every time.
Aiming for 70–75% utilization usually strikes the right balance between client work and the admin tasks that keep your operation running. It prevents burnout and makes sure you aren’t leaving money on the table.
Quick Tips
- Double-check your tax assumptions quarterly to avoid unwelcome surprises.
- Tag every entry as billable or non-billable in DeskCove for a crystal-clear utilization breakdown.
- Tweak your targets when business slows down or picks up—seasonality matters.
- Jot down notes with each rate change so you can see what really moves the needle.
Can I Use DeskCove Data For Project-Based Pricing?
Absolutely. Export your time entries by client, add any direct expenses, and you’ll have a precise hour count to start with. Then apply your hourly rate to that total and compare it against the flat fee you’re considering.
This simple exercise highlights potential gaps and helps you avoid underquoting on future projects.
How Often Should I Revisit My Hourly Rate?
Set a quarterly reminder to run through your latest expenses, utilization trends, and market rates. Checking in every three months keeps you in sync with inflation, new costs, and shifting client budgets.
“Revisiting rates regularly is the simplest way to protect your margins against hidden cost creep.”
| Question | Action Step |
|---|---|
| Adjust For Taxes | Gross-up rate by 1/(1 – tax rate) |
| Set Utilization Target | Use DeskCove data to aim at 70–75% |
| Project-Based Pricing With DeskCove | Export and model hours before quoting |
| Rate Review Frequency | Add quarterly calendar reminders |
Ready to simplify rate-setting and boost profitability? Try DeskCove now for real-time time tracking and detailed reports that turn data into strategic pricing decisions.