
What Is Earned Value Management and How Does It Work

Ever heard of Earned Value Management (EVM)? Don't let the name intimidate you. Think of it as a powerful GPS for your project. While standard budget tracking tells you what you've spent, EVM goes a step further—it shows you how much actual progress you've made for that money. This combo is the secret to knowing if you're truly on track, falling behind, or blowing the budget.
Unlocking True Project Performance
Traditional budget tracking is like driving while only looking in the rearview mirror. It shows you where you've been, but not where you're going. You might know you've spent 50% of the budget, but are you actually 50% done with the work? That's the critical blind spot that EVM eliminates.
It moves past a simple "budget vs. actuals" comparison to answer a much more important question: Are we getting the value we planned for the money and time we've put in?
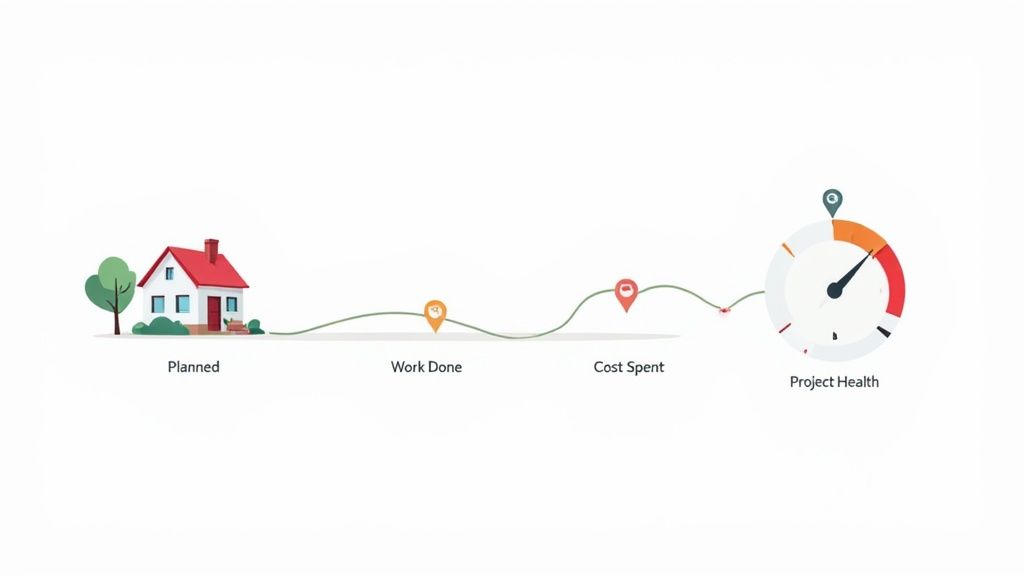
This method acts as an early warning system, helping project managers spot trouble long before it can derail the entire project. The whole idea is to measure your team's performance against a fixed plan by blending three key dimensions of any project:
- Scope: What work needs to get done?
- Schedule: When is that work supposed to be finished?
- Cost: How much did we budget for that work?
To give you a clearer picture, EVM is designed to give straightforward answers to some fundamental project questions.
The Three Questions EVM Answers
This table outlines the fundamental questions Earned Value Management is designed to answer, giving you a clear snapshot of its purpose.
| The Core Question | What It Tells You |
|---|---|
| Where were we supposed to be? | This compares your progress against the original project schedule. |
| Where are we now? | This shows the actual work completed and the real costs incurred so far. |
| Where are we going? | This uses current performance data to forecast the project's final cost and completion date. |
By tackling these three questions, EVM provides a complete and objective health check for your project.
A Proven Methodology
EVM isn't some new buzzword. Its roots go back to the U.S. Department of Defense in the 1960s, where it was developed to get a better handle on massive, complex contracts. It was a game-changer because it integrated scope, schedule, and cost into one unified system for objective evaluation.
By combining these three elements, EVM provides a holistic and quantitative assessment of project health, replacing subjective guesswork with data-driven insights. It is a cornerstone of effective performance measurement.
Of course, before you can measure anything, you need a solid plan to measure against. This is where the concept of baselining a project comes in. A baseline freezes your initial plan for scope, schedule, and cost, creating the yardstick EVM uses for all its calculations. To learn more about this, check out our guide on what performance measurement is and why it's so critical for success.
Understanding the Three Pillars of EVM
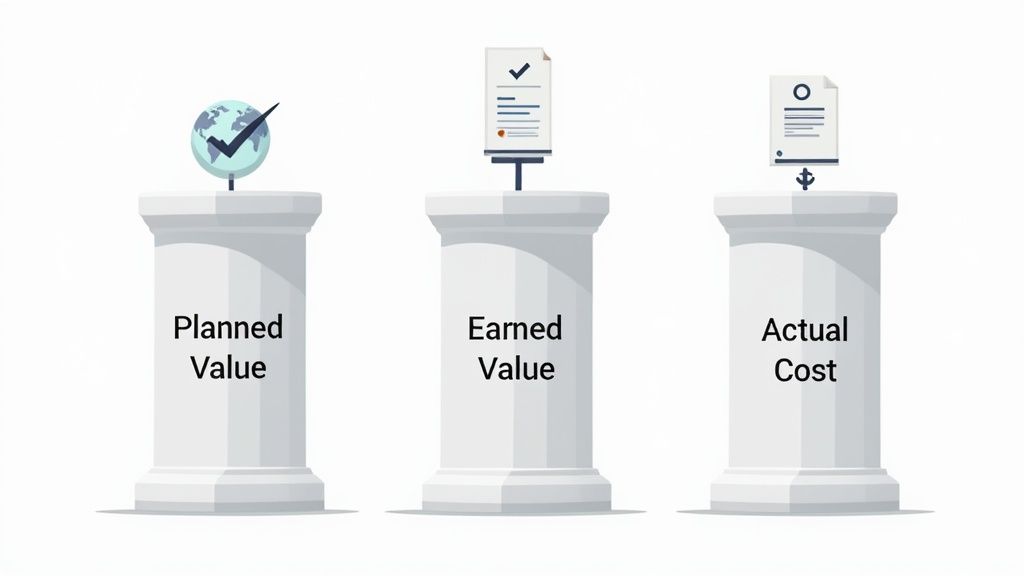
Before you can really put Earned Value Management to work, you have to get comfortable with its three core metrics. Think of them as the foundation of the whole system: Planned Value (PV), Earned Value (EV), and Actual Cost (AC). These are the raw numbers that power every single calculation and insight EVM offers.
They each tell a different part of your project's story. But the real magic happens when you bring them together to get a clear, objective look at your project's health. Let's dig into each one.
Planned Value (PV): The Project Blueprint
Planned Value (PV) is simply the authorized budget for the work you planned to complete by a certain date. It’s your baseline, your roadmap. Put another way, it answers the question: “How much work did we expect to have done by now?”
Let's say you're running a 10-month project with a total budget of $100,000. If your plan spreads the work out evenly, your PV at the end of month five would be $50,000. It’s the benchmark you set from the very beginning.
Planned Value is your project's financial yardstick. It's not a guess; it's the approved budget for the work scheduled to be accomplished, derived directly from your project plan.
This metric is your starting point—everything else gets measured against it. You calculate it before any work starts, often by breaking down the project into smaller pieces. You can see exactly how work breakdown structures simplify project management to help map this out.
Earned Value (EV): The Work Accomplished
Next up is Earned Value (EV). This is the value, in budget terms, of the work you've actually finished. This is the heart of EVM because it answers the most important question: “What is the value of the work we have actually completed?”
Let's stick with our $100,000 project. At the five-month check-in, you review the progress and determine that only 40% of the total project is truly done. That means your Earned Value is 40% of the total budget, or $40,000.
What makes EV so powerful is that it translates real-world progress into a dollar amount. This gives you an apples-to-apples way to compare what you’ve done against what you planned to do and what you've spent.
Actual Cost (AC): The Money Spent
Finally, there’s Actual Cost (AC), which is exactly what it sounds like. It's the total amount of money you've actually spent to get the work done so far. It answers the straightforward question: “How much have we paid out to date?”
Continuing our example, let's say after five months, you check the books and see you've spent $45,000. That number is your AC. It's the cold, hard cash that has left the bank.
Let's put it all together:
- Planned Value (PV): $50,000 (Where you should be)
- Earned Value (EV): $40,000 (Where you actually are in terms of progress)
- Actual Cost (AC): $45,000 (What you've actually spent)
With just these three numbers, you're ready to move past basic budget tracking. Now you can start calculating the key performance indicators that will tell you if you're behind schedule, over budget, or both—which is exactly what we'll tackle next.
Measuring Performance with Key EVM Metrics
Once you've nailed down your three core numbers—Planned Value, Earned Value, and Actual Cost—you get to unlock the real power of Earned Value Management. Think of these pillars as the building blocks for several key performance indicators (KPIs) that give you an immediate, objective snapshot of your project's health. You're moving from just gathering data to generating real, actionable intelligence.
These metrics fall into two main camps: variances and performance indices. Simply put, variances tell you the size of any deviation from your plan, while indices tell you how efficient you're being.
Analyzing Project Variances
Variances measure the raw difference between your plan and your reality, for both your schedule and your budget. They are calculated with simple subtraction and spit out a direct dollar value that shows exactly how far off track you are.
There are two primary variances you need to get comfortable with:
-
Schedule Variance (SV): This metric tells you if you're ahead of or behind schedule, but it expresses it in monetary terms. The formula is SV = EV – PV. A positive result is great—you're ahead of schedule. A negative number is a warning sign that you've fallen behind.
-
Cost Variance (CV): This one reveals if you're under or over budget for the work you've already knocked out. The formula is CV = EV – AC. A positive CV means you're under budget (fantastic news!), while a negative CV is a red flag that you're spending more than planned.
These numbers give you the clear financial impact of where your project stands right now. But they don't quite tell the full story about your team's efficiency.
Gauging Efficiency with Performance Indices
Performance indices take the analysis a big step further. Instead of just showing a dollar variance, they give you a ratio that reveals how efficiently your team is using its time and money. This makes it much easier to compare performance across different projects or even different phases of the same project.
A value of 1.0 is the magic number for performance indices—it means your project is performing exactly as planned. Any deviation from 1.0 indicates a performance issue that needs attention.
Here are the two crucial performance indices:
-
Schedule Performance Index (SPI): This measures your schedule efficiency—how well you're progressing compared to the plan. The formula is SPI = EV / PV. An SPI greater than 1.0 means you're ahead of schedule, while an SPI less than 1.0 confirms you're dragging behind.
-
Cost Performance Index (CPI): This is arguably the most critical EVM metric because it measures your cost efficiency. The formula is CPI = EV / AC. A CPI greater than 1.0 means you're getting more value than you're paying for (under budget). A CPI less than 1.0 shows you're over budget for the work completed.
Getting a handle on these four metrics is fundamental to knowing how to measure project success with cold, hard data. Once calculated, presenting these EVM metrics clearly is crucial for effective project oversight. An impactful business performance metrics dashboard can significantly enhance your ability to track project health and make timely decisions.
A Practical Step-by-Step EVM Example
Theory is one thing, but Earned Value Management really comes to life when you see it in action. Let's walk through a straightforward scenario to turn these abstract formulas into a powerful decision-making tool you can actually use.
Imagine your team is building a new company website. The project has a total budget of $20,000 and a deadline of four months. To keep things simple, we'll assume the work and budget are spread out evenly across the timeline.
This simple diagram shows how we'll get from the raw data to real, actionable insights.
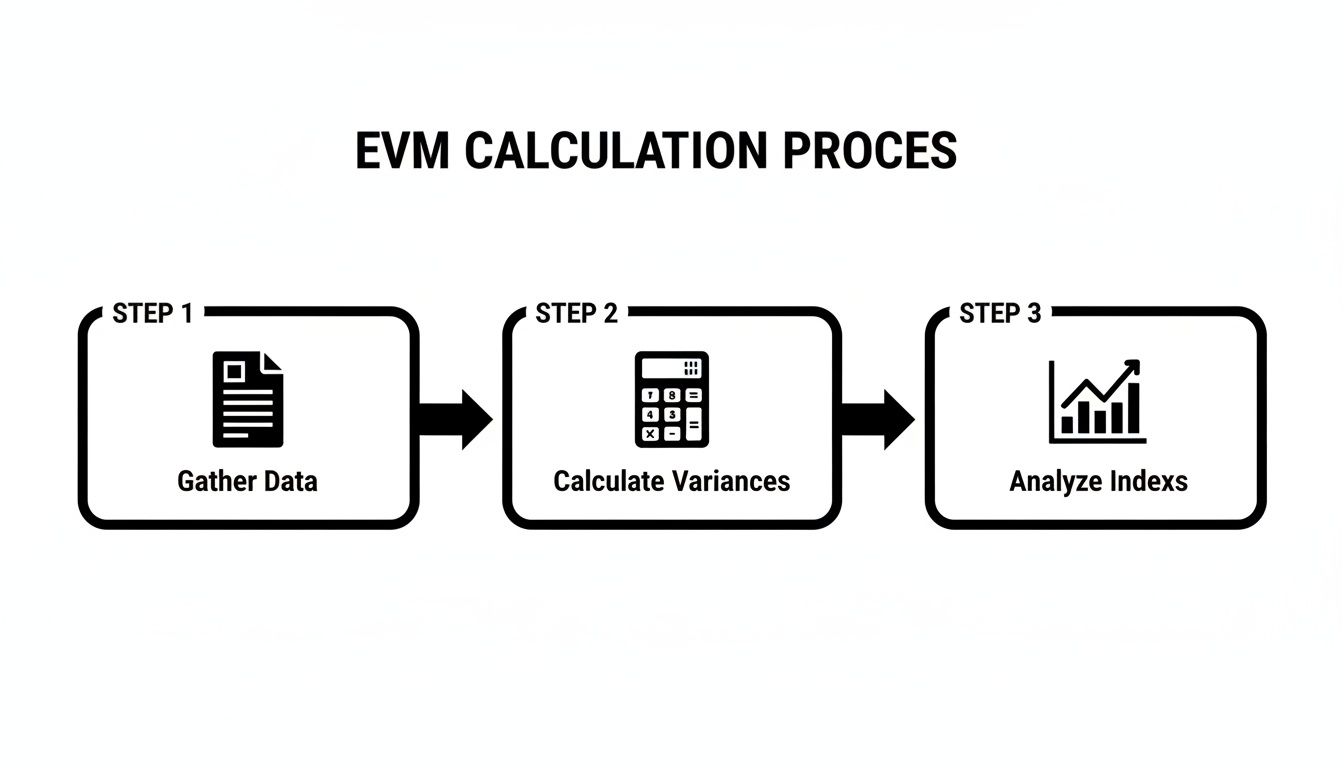
As you can see, the process is logical: we start by gathering our core data, then we run the numbers to find our key metrics, and finally, we analyze the results to see exactly where the project stands.
Setting the Scene Two Months In
Let's hit pause on our project at the two-month mark—that's 50% of the way through the schedule—to perform a health check. This is where we need to gather the three foundational data points for EVM.
- Planned Value (PV): We planned to be halfway done. So, our PV is 50% of the total budget: $20,000 x 0.50 = $10,000. This is the value we expected to create by now.
- Earned Value (EV): After reviewing the actual work delivered (like wireframes, design mockups, and initial code), the team agrees they’ve only completed 40% of the total project. So, our EV is 40% of the budget: $20,000 x 0.40 = $8,000. This is the value of the work we've actually finished.
- Actual Cost (AC): We look at the books and see the project has spent $9,000 on labor and other resources so far. This is what we've actually paid.
With these three numbers in hand, we're ready to calculate the variances and performance indices to get the full story.
Calculating the Variances and Indices
Now for the fun part. Using the formulas we've discussed, we can quickly diagnose the project's condition. This is where you'll see why EVM is such a game-changer.
To make this crystal clear, here’s a table that breaks down the entire calculation and interpretation process for our website project.
EVM Calculation and Interpretation Walkthrough
| Metric | Formula | Example Value | Interpretation |
|---|---|---|---|
| Schedule Variance (SV) | EV – PV | $8,000 – $10,000 = -$2,000 | The negative value means we're behind schedule. We've completed $2,000 less work than we planned to by this point. |
| Cost Variance (CV) | EV – AC | $8,000 – $9,000 = -$1,000 | The negative value shows we're over budget. We've spent $1,000 more than the value of the work we've accomplished. |
| Schedule Performance Index (SPI) | EV / PV | $8,000 / $10,000 = 0.8 | An SPI below 1.0 confirms we're behind. We are working at only 80% of our planned efficiency. We're losing time. |
| Cost Performance Index (CPI) | EV / AC | $8,000 / $9,000 = 0.89 | A CPI below 1.0 confirms we're over budget. For every dollar spent, we're only getting 89 cents of value in return. |
The data paints a clear—and troubling—picture. We are behind schedule and over budget. Without EVM, a manager might just look at the $9,000 spent and compare it to the planned $10,000, thinking, "Great, we're under budget!" They would completely miss the fact that the project is dragging its feet, which is a huge risk.
This is the power of EVM. It provides an objective early warning system, transforming simple data into the clarity a project manager needs to take control. With this information, they can dig into the root causes of the delay, reassign resources, or have an honest conversation with stakeholders about adjusting the scope to get the project back on solid ground.
Benefits and Limitations of Using EVM
Let's be clear: no project management method is a silver bullet, and Earned Value Management is no different. While it offers some incredibly powerful insights, it's not a one-size-fits-all solution. A smart project manager knows both its strengths and its weaknesses to decide when and how to use it effectively.
The biggest win with EVM is its ability to give you an objective, data-driven look at your project's health. It forces you to move beyond vague updates like "we're about 80% done" and instead rely on hard numbers. This quantitative approach is fantastic for fostering clear communication and real accountability, since everyone is measuring performance against the same concrete baseline.
The Key Advantages of EVM
Think of EVM as an early warning system. By constantly checking your cost and schedule performance against the plan, it flags problems long before they turn into project-killing disasters. This proactive insight is invaluable—it gives you a chance to take corrective action while there’s still time to actually make a difference.
On top of that, EVM gives you a surprisingly reliable way to forecast the future. Using metrics like the Cost Performance Index (CPI) and Schedule Performance Index (SPI), you can project the final cost and completion date with a solid degree of accuracy.
Key benefits really boil down to this:
- Objective Performance Measurement: It swaps guesswork for real, quantifiable data on how efficiently you're using time and money.
- Improved Forecasting: You can use past performance to make much more accurate predictions about where the project will end up.
- Enhanced Stakeholder Communication: It provides clear, standardized metrics that are easy for everyone to understand and almost impossible to argue with.
- Integrated Project Control: EVM elegantly ties scope, schedule, and cost together into one cohesive framework for analysis.
Potential Challenges and Limitations
For all its power, EVM isn't without its hurdles. Getting started can be a heavy lift. It demands a detailed work breakdown structure and a stable project baseline from the get-go. If you don't build this solid foundation, every calculation that follows will be unreliable. This upfront effort can be a tough sell for teams used to more flexible planning.
Furthermore, EVM is completely dependent on accurate and timely data. Garbage in, garbage out. If your organization can't track actual costs or measure work completion with precision, the system’s outputs are going to be flawed. This need for solid data is why we've seen a surge in EVM software. In fact, the global market for this software is expected to hit around USD 1.5 billion by 2025, with major adoption in construction, IT, and manufacturing. You can dig into the numbers in this research report on EVM software.
A common pitfall is treating EVM as a purely mechanical process. The real value comes from interpreting the data to ask the right questions and drive strategic decisions, not just from generating the numbers themselves.
Finally, the rigid nature of EVM just isn't a great fit for every project. For highly creative or agile projects where the scope is supposed to evolve, trying to lock it into a fixed baseline can completely stifle innovation. In those situations, a modified or hybrid approach is probably a much smarter way to go.
Your Top EVM Questions, Answered
As project managers start digging into Earned Value Management, a few common questions always pop up. It's one thing to understand the theory, but making it work in the real world brings up a whole new set of challenges. This section tackles some of the most persistent questions about putting EVM into practice.
We're here to clear the fog around these concepts and help you move forward with confidence. Whether you’re thinking about EVM for the first time or just want to sharpen your approach, you'll find the clarity you need right here.
Can Earned Value Management Be Used with Agile Projects?
Absolutely. EVM can be a fantastic tool for Agile projects, but you have to shift your thinking. Instead of measuring against one giant, fixed plan, you measure performance iteration by iteration.
In an Agile setting, Earned Value is usually tied to the number of story points your team completes versus what was planned for that sprint. This gives you an incredible, near-real-time feedback loop on how efficiently you’re using time and money within each cycle.
The secret is adapting the principle of EVM to fit Agile's core mission: delivering value in small, steady increments. It becomes less about sticking to a rigid, long-term plan and more about measuring the tangible value you ship in each short burst of work.
What Is the Difference Between EVM and Traditional Budget Tracking?
Traditional budget tracking is pretty one-dimensional. It just compares what you planned to spend with what you’ve actually spent. It can tell you if you're over or under budget, but it gives you zero context about how much work you’ve actually done. For example, you might be $10,000 under budget, but only because you're hopelessly behind schedule and haven't even started some key tasks.
EVM adds a crucial third dimension: the value of the work you’ve actually finished, which we call Earned Value (EV).
This one change gives you a far more honest and complete picture of project health. It answers a much better question: "For the work we've actually done, how much should we have spent?" This integrated view stops managers from being fooled by budget numbers that look good on the surface but are really hiding serious schedule problems.
How Do I Start Implementing EVM in My Organization?
The best advice? Start small. Pick a single, well-defined pilot project instead of trying to roll EVM out across the entire company at once. This gives your team a lower-risk space to learn the ropes.
Before you even begin, you need to have rock-solid systems for tracking two things:
- Actual Costs: You must know exactly what you’re spending on labor, materials, and everything else.
- Work Completed: You need a clear, objective way to measure progress—whether that's hitting milestones, counting finished units, or another concrete method.
Without accurate data, EVM is useless. You can kick things off with a simple spreadsheet to track PV, EV, and AC before you even think about buying specialized software. Your first goal should be training your team on the core ideas and showing them how CPI and SPI can lead to smarter decisions. Once you’ve proven it works on a small scale, you can build a smart plan to expand EVM to bigger, more complex projects.
Ready to get a crystal-clear view of your team's productivity and project costs? DeskCove provides the detailed time and activity data needed to fuel your EVM calculations and drive smarter, data-driven decisions. Take the guesswork out of remote work management and start improving your project outcomes. Visit https://deskcove.com to see how it works.
