How to Measure Team Productivity Effectively

For way too long, the whole conversation around productivity has been stuck in a factory mindset—crank out more widgets, log more hours, just produce more. In today's knowledge-based world, that approach isn't just old-fashioned; it's flat-out wrong. Chasing activity for activity's sake just breeds a culture of "busy work," where everyone's focused on looking productive instead of actually being productive.
The real challenge now is figuring out how to measure what truly drives value. That means we need to stop obsessing over individual activity and start understanding collective team effectiveness. A team's true power is in its ability to hit goals, come up with new ideas, and push the business forward.

From Activity to Impact
Switching your focus to impact means you start asking a totally different set of questions. Instead of, "How many hours did the team log?" you should be asking, "How did the team's work actually move our goals forward?" This simple shift is the secret to building a high-performing culture.
When we talk about measuring productivity, we're really talking about a few core pillars that have evolved over time. The old way was all about inputs and outputs, but the modern approach is much more holistic, focusing on the actual value created.
Here's a quick look at how to frame this new approach:
Core Pillars of Modern Productivity Measurement
| Pillar | Description | Example Metric |
|---|---|---|
| Efficiency | Getting work done with the right amount of effort and resources—not just faster, but smarter. | Project completion time, resource utilization rate |
| Quality | Ensuring the work produced meets or, ideally, exceeds the set standards. High output of poor work is a net loss. | Customer satisfaction scores (CSAT), bug/error rates, revision requests |
| Timeliness | Hitting deadlines and keeping projects on schedule. Consistency is key here. | On-time delivery rate, milestone completion percentage |
| Business Impact | The big one: Does the team's work actually help the company's bottom line? | Contribution to revenue goals, feature adoption rates, customer retention |
Ultimately, a modern view of productivity has to include a mix of these elements. Focusing on just one pillar, like efficiency, can lead you to neglect quality or overall business impact, which is a recipe for long-term problems. It's all about finding the right balance for your team and your goals.
Globally, measuring productivity has been a massive challenge. In 2024, labor productivity growth across 40 OECD countries crept up by only 0.4%. That's a huge drop from the pre-pandemic annual average of 1.8% between 2015 and 2019. While the United States saw a 1.5% increase, partly thanks to new tech, Europe's growth was much slower. You can dig into more of these global productivity trends from Archie.
Defining Productivity Metrics That Actually Matter
Before you can measure anything, you have to know what you're measuring and why it's important in the first place. Just tracking random activities without tying them back to actual business goals is a fast track to busywork. The best productivity metrics tell a story about your team’s impact, not just their effort.
The real trick is to shape these metrics around your team's specific role and objectives. Generic advice just doesn't work here. What signals success for a sales team is completely different from what matters to your software developers. It’s all about moving beyond simple output counts and getting to the heart of performance.
Take a marketing team, for instance. They could focus on pumping out a high volume of leads. But a much smarter metric would be lead quality or the number of marketing-qualified leads (MQLs) that actually turn into sales. This tiny shift in focus moves the team from just being busy to creating real business value.
Aligning Metrics with Team Goals
Different teams need different ways to look at their productivity. Your goal is to find the key indicators that show genuine progress toward their unique objectives. Think past the final output and consider the entire process that gets them there.
Here are a few scenarios to get you thinking:
- Software Development: Forget tracking lines of code—it’s a notoriously bad metric. Instead, zero in on things like code stability (how many bugs pop up after deployment?), cycle time (the time from starting a task to getting it done), and feature adoption rates. This approach measures quality and impact, not just volume.
- Customer Support: Ticket volume is a common starting point, but it doesn't paint the full picture. Far better metrics include the first-contact resolution rate, customer satisfaction (CSAT) scores, and the average time to resolve an issue. These tell you about both efficiency and customer happiness.
- Sales Team: Don't stop at closed deals. Dig deeper with metrics like sales cycle length, customer lifetime value (CLV), and pipeline conversion rates. These give you a much richer understanding of long-term success.
A wider economic view backs this up. The OECD's multifactor productivity measures don't just look at labor; they compare outputs to capital and materials, too. In 2022, a shocking 66 out of 86 U.S. manufacturing industries saw their total factor productivity drop, which shows just how vital input efficiency is at every single level.
To make sure you're tracking indicators that provide real insight, it's worth exploring what metrics really matter and how AI can surface them in today's world. Building a custom dashboard that visualizes these carefully selected metrics is key to telling a clear, actionable story about your team's performance. You can learn more about how to measure productivity metrics to optimize business outcomes in our detailed guide.
Choosing the Right Tools for Data Collection
Once you have a solid idea of what metrics to track, the next logical step is picking the technology to actually gather that data. This isn't about setting up a surveillance state; it’s about choosing tools that genuinely help your team by offering clear insights into how work gets done. The whole point is to collect information that helps everyone improve, not to micromanage.
The world of productivity tools is huge, mixing big-name project management platforms with more focused time and activity trackers. These systems become incredibly powerful when you set them up to monitor the specific things you’ve already decided are important, like how quickly tasks are completed, how long a project really takes, or even which apps are being used most often.
Think about how DeskCove visualizes data, for example. It gives you a clean dashboard that tracks both time and activity levels.
When you can see the data laid out like this, you start noticing patterns in how your team works and where their focus goes. That makes it a whole lot easier to spot where things might be getting stuck.
Selecting Technology That Builds Trust
Let’s be honest: how you introduce these tools is just as critical as which ones you pick. You have to be completely transparent. Your team needs to hear from you—loud and clear—that the goal is to make processes better and support their work, not to watch their every click.
With that in mind, look for features that reflect this philosophy. You’ll want a platform that offers things like:
- Task-Based Tracking: This is key. It connects all time and activity directly to a specific project or task, which keeps the focus squarely on outcomes, not just being "busy."
- User-Controlled Monitoring: Look for tools that let team members start and stop the tracker themselves. This gives them a sense of ownership and autonomy over their work sessions.
- Clear Reporting: Find a tool with dashboards that both managers and employees can see. When everyone is looking at the same information, it creates a shared sense of understanding and accountability.
For remote teams, getting the technology right is even more important. We’ve actually put together a guide on the best remote work productivity tools that are built to support distributed teams.
The big idea here is to frame data collection as a team effort. This isn't a top-down evaluation machine. Position the tool as a resource that helps the team spot hurdles and celebrate wins together. That’s how you build the psychological safety needed for real improvement.
Communicating Purpose over Process
Before you roll out any new tool, get the team together for an open conversation. Don't just talk about what the tool does; explain the why behind it. Tie the data you’ll be collecting directly back to those team-focused metrics you all agreed on earlier.
You could say something like, "We're going to start using this tool to get a real picture of how long our QA process takes. The data will show us if we need more hands on deck or a smarter workflow, so we can all spend less time on frustrating revisions."
See the difference? This approach turns the tool from a "boss-in-a-box" into a problem-solving partner. By focusing on process improvement and being upfront about what's being tracked and why, you'll earn the trust and buy-in you need for this to succeed. It ensures everyone sees the technology as a plus for their day-to-day work, not just another thing to deal with.
Weaving Engagement and Well-Being into Your Metrics
Measuring productivity by focusing only on output is like driving a car while staring at the speedometer. Sure, you know how fast you're going, but you have no clue if you're about to run out of gas or if the engine is overheating. A burnt-out, disengaged team will eventually hit empty, and when they do, their output will crash. Ignoring the human element isn't just a simple oversight; it's a massive strategic failure.
Metrics like employee engagement, job satisfaction, and even turnover rates aren't just "nice-to-have" HR stats. They're powerful leading indicators that give you a clear glimpse into your team's future performance. A sudden drop in morale almost always comes before a dip in output, making these qualitative data points absolutely essential for staying ahead of problems.
It's not just a gut feeling; the data backs it up. Globally, only about 21% of employees felt actively engaged at work in 2024. This isn't just a morale issue—it's estimated to cost the global economy a staggering $438 billion in lost productivity. On the flip side, organizations with high employee engagement often see productivity jump by 20% to 25%. You can dig deeper into these crucial productivity statistics on TeamOut.
How to Actually Gather Qualitative Data
So, how do you get your hands on this crucial, less tangible information? The trick is to create consistent, safe channels for feedback. This isn't about sending out one massive annual survey; it’s about building an ongoing conversation to genuinely understand your team's experience.
Here are a few practical ways to get started:
- Pulse Surveys: Think of these as quick, frequent check-ins. A few questions sent out weekly or bi-weekly can give you a real-time gauge on team sentiment about workload, management support, and general morale without creating survey fatigue.
- One-on-One Meetings: Don't just talk about tasks. Dedicate real time in your one-on-ones to well-being. Ask open-ended questions like, "What's one thing we could change to make your work more manageable?" or "How are you really feeling about your current projects?"
- Anonymous Feedback Tools: Let's be honest, sometimes people are more willing to share tough feedback when their name isn't attached. A simple, anonymous digital suggestion box can uncover critical issues you might never hear about otherwise.
Connecting the Dots Between Morale and Performance
When you're trying to figure out how your team is really doing, you have to look beyond just the output and understand how to measure employee engagement effectively.
Imagine this real-world scenario: A project manager sees that a historically high-performing software team has started missing deadlines. The output metrics, like story points completed, are clearly tanking, but they don't explain why.
Instead of just cracking the whip, the manager looks at the qualitative data from recent pulse surveys and discovers the team is completely burnt out after a long crunch period. Armed with this insight, they can take direct action—maybe by enforcing a "no-meetings Friday" or re-prioritizing the backlog to give the team some breathing room. This kind of intervention addresses the root cause, revitalizes the team, and soon enough, their output climbs back to normal. This is how you shift from just seeing what is happening to truly understanding why.
Turning Your Data into Actionable Insights
Collecting data is just the beginning. The real magic happens when you start analyzing it. A dashboard full of raw numbers doesn't tell you much without context. The goal is to get past the surface-level metrics and uncover the real story your data is telling about how your team works.
Think about it: a sudden drop in a team's output could mean anything. Is a clunky new process to blame? Are they missing the right tools? Or is it something more human, like your team is on the fast track to burnout? Your job isn't just to report the numbers, but to dig in and find out what's really going on.
From Observation to Interpretation
Looking at data is a bit like being a detective. Instead of just noting that "project completion times have increased by 15%," you have to ask why. This is where you connect the dots between different data points to see the full picture. Maybe project time is up, but so is the customer satisfaction score for that feature. That suggests the team is taking more time to focus on quality—a trade-off you'd probably welcome.
To help diagnose your team's health, a decision tree like this one can be a great starting point, kicking things off with engagement levels.
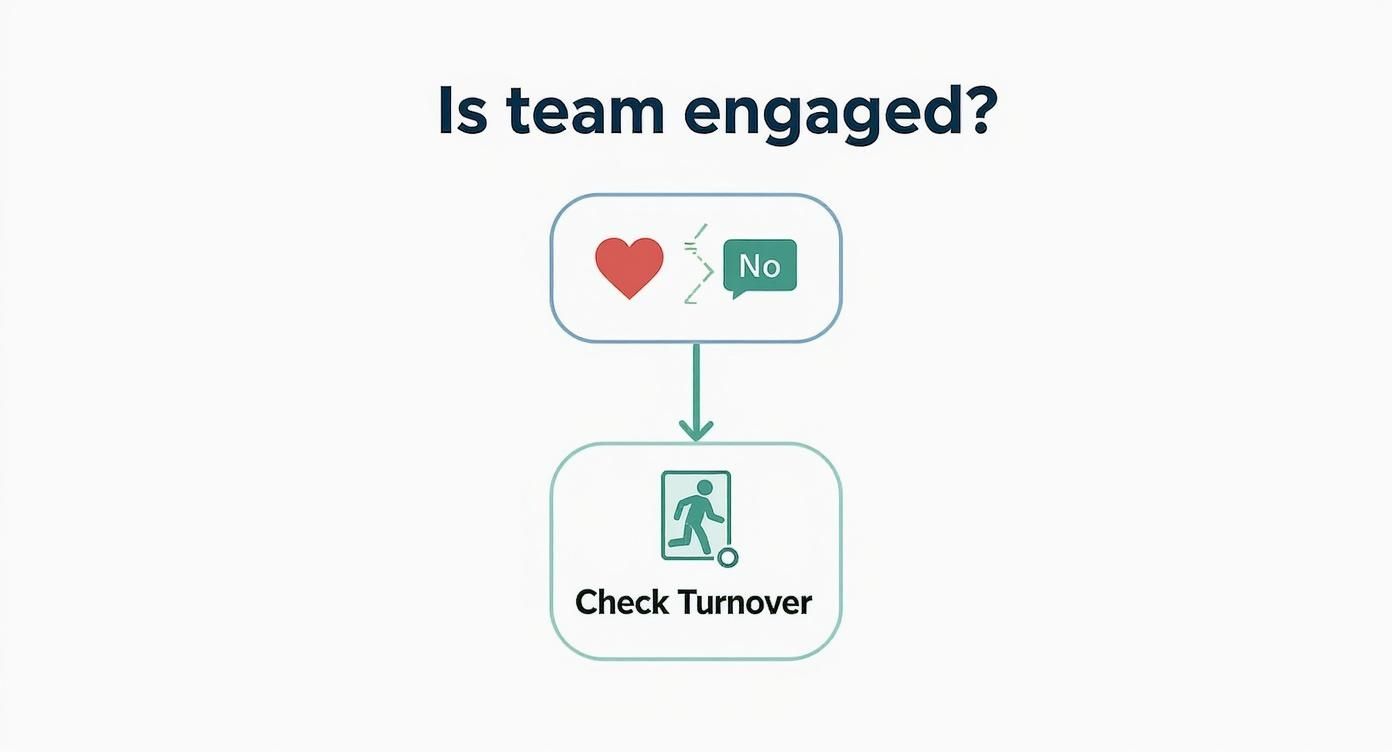
This visual shows how a lack of engagement is often the first sign of deeper problems, like high turnover. It's a great reminder to always look for the human factors hiding behind the numbers.
Diving into these trends is at the heart of workforce analytics. Getting a handle on its core principles can seriously level up your ability to make sense of the data. For a deeper dive, check out our guide on what is workforce analytics and how you can put it to work.
Interpreting Common Productivity Patterns
As you get comfortable with your data, you'll start to see recurring patterns. Understanding what these trends might signal is crucial for taking the right next step. This table breaks down some common observations and what they could mean.
| Observed Pattern | Potential Cause | Next Step |
|---|---|---|
| High Activity, Low Output | Inefficient workflows, excessive meetings, or lack of clear priorities. | Review team processes and meeting schedules. Conduct a quick poll to see where team members feel their time is being wasted. |
| Sudden Productivity Spike | A looming deadline, a highly motivating project, or unsustainable "crunch time." | Acknowledge the team's hard work, but investigate if the pace is sustainable. Check for signs of burnout. |
| Consistent Drop in Productivity | Team burnout, unclear project goals, new process friction, or resource shortages. | Open a conversation with the team. Ask about current blockers and review the clarity of recent project briefs. |
| Productivity Dips on Certain Days | Could be linked to recurring meetings, administrative tasks, or a predictable lull in the project cycle. | Analyze the tasks scheduled on those days. Could a standing meeting be moved or turned into an async update? |
Recognizing these patterns helps you move from just seeing the data to actually understanding it. It's the first step toward making meaningful improvements.
Facilitating Productive Team Discussions
Data should never be a weapon in a performance review. Period. Instead, think of it as a conversation starter for solving problems together. When you bring data into team meetings, it depersonalizes feedback and shifts the focus from people to processes.
Frame data discussions around curiosity. Start with questions like, "I noticed we have a bottleneck here. What are your thoughts on what might be causing it?" This approach invites open, honest dialogue and empowers the team to own their solutions.
This simple shift turns productivity measurement from a top-down evaluation into a team-wide effort for continuous improvement. When you work together to turn insights into action plans, you build a culture where data is seen as a helpful tool for everyone, not a method of control.
Building a Culture of Continuous Improvement
Measuring team productivity isn't a project you can just check off a list. It's a living, breathing process of constant refinement. The data you gather is only as good as the improvements it sparks. Think of it as creating an ever-evolving system for getting better, one that grows and adapts right alongside your team and your company's goals.
The metrics that feel right today might be totally wrong six months from now. As your projects pivot and priorities get shuffled, your yardstick for measuring success has to be just as nimble. You've got to revisit your KPIs regularly to make sure they still make sense. This simple habit helps you avoid "metric inertia"—that dangerous state where teams are just chasing old targets that don't push the business forward anymore.
It All Starts with Psychological Safety
For any of this to actually work, you need a culture where people feel safe enough to speak up. When your team isn't terrified of admitting failure or pointing out a clunky process, you get the honest conversations that lead to real breakthroughs. This feeling of psychological safety is the absolute bedrock of continuous improvement.
True agility in performance measurement means treating data not as a final grade, but as the starting point for a conversation. The goal isn't to judge past performance but to collectively discover better ways of working in the future.
This small shift in mindset changes everything. It moves the focus from scrutinizing individuals to solving problems as a team. It's about empowering people to flag their own bottlenecks and come up with their own solutions.
Use Reviews for Strategy, Not Scrutiny
One of the best ways to bring this to life is by holding regular productivity reviews—maybe once a quarter. The key here is to frame these sessions as collaborative workshops, not performance evaluations.
Here’s what you should be talking about in those meetings:
- What the Data is Telling Us: Look at the trends in your key metrics together. What stories are the numbers telling about your workflow? Is there a pattern?
- Insights from the Trenches: Ask the team directly: "What feels slow? Where are you getting stuck?" Their on-the-ground experience is often more telling than any dashboard.
- Let's Try Something New: Brainstorm a few small process changes you can test before the next review. Agree on just one or two experiments. This makes improvement feel manageable and less overwhelming.
When you treat productivity measurement as an ongoing, team-wide effort, you get so much more than just numbers on a screen. You build a resilient culture where every single person is invested in finding smarter, better ways to hit your shared goals.
Frequently Asked Questions
Even with a solid game plan for measuring team productivity, a few common questions always pop up. Getting these sorted out clears up any confusion and helps you handle the little bumps in the road with more confidence. It’s these details that really make the difference.
How Often Should I Measure Team Productivity?
This is a big one. The short answer? Consistency is way more important than frequency.
If you’re on a fast-moving project with a tight deadline, you might need to peek at the key metrics weekly just to keep the train on the rails. But for your bigger, long-term goals, a monthly or even quarterly review is usually much more insightful. That gives you enough data to spot real trends instead of just reacting to daily noise.
The trick is to find a rhythm that works for your team. Use real-time dashboards for a quick daily pulse check on progress, but save the deep-dive analysis for those dedicated review meetings. This way, you stay informed without drowning your team in constant scrutiny.
Here’s the key distinction: monitoring is different from analyzing. You can monitor things continuously, but deep analysis should be periodic. That's how you uncover strategic insights, not just knee-jerk reactions to daily ups and downs.
What's the Difference Between Activity and Productivity?
Ah, the classic question. Getting this right is probably one of the most important things you can do.
Activity is just being busy. Think clearing out an inbox, jumping from meeting to meeting, or making a bunch of calls. Productivity, on the other hand, is about achieving outcomes that actually move the business forward.
Measuring activity—like how many hours someone spends at their desk—tells you almost nothing about how effective they are. Someone could be "active" for eight hours straight and produce zero real value. True productivity measurement zeroes in on results that matter: the number of support tickets successfully closed, the quality of leads generated, or the user engagement on a new feature. When you focus on outcomes, you ensure everyone's effort is actually making a dent.
How Can I Measure Productivity for Creative Roles?
Measuring the output of designers, writers, or developers can feel tricky. You can't just count widgets. For creative and knowledge-based work, leaning solely on quantitative metrics is not just misleading—it can actively kill innovation. The best approach is a blend of qualitative and quantitative measures.
Instead of volume, focus on impact. For a design team, for example, you could look at how a new campaign design affected conversion rates or how users are engaging with a new UI.
You’ll also want to fold in other signals:
- Peer and stakeholder feedback: How is the quality of the work perceived by the people who rely on it?
- Project timeliness: How well did the team stick to its initial estimates? This speaks to planning and execution.
- Number of revisions: Fewer revisions might point to clearer initial briefs and higher-quality first drafts.
The goal isn't to count how many drafts were created, but to measure the overall effectiveness and quality of what was ultimately delivered.
Ready to stop guessing and start building a more productive team with real data? DeskCove gives you the tools to track time, see progress clearly, and understand how work actually gets done. It’s time to make decisions based on insight, not intuition.