Your Team Capacity Planning Template for Better Workloads

Trying to assign tasks based on guesswork is a surefire way to burn out your team and miss project deadlines. A simple to-do list just doesn't cut it anymore, especially now that so many teams are remote or hybrid. A solid team capacity planning template is what you need to shift from hoping for the best to strategically balancing workloads based on who's actually available.
Why Your Old Planning Methods Don't Work Anymore

Let’s be honest: giving a task to whoever seems the least busy is a common but deeply flawed approach. This reactive style of management creates a cycle of problems that many managers know all too well. It’s that feeling of constantly putting out fires, where unexpected bottlenecks derail entire projects and key team members are always overloaded.
When workloads aren’t clearly visible, projects inevitably slip. A study on workplace stress found that unreasonable time pressure is a huge problem, with 70% of employees more likely to experience burnout when facing it. This isn't just about morale; it directly tanks productivity and pushes good people to leave.
The Limits of Reactive Management
Relying on old-school methods like basic spreadsheets or simple task lists creates several pain points that get in the way of growth. Without a clear view of everyone's commitments, making informed decisions is nearly impossible.
These traditional approaches often fail because they don't capture the full picture. They completely overlook the real-world factors that eat up a team's time and energy, such as:
- Invisible Work: Think about all those recurring meetings, administrative tasks, and surprise requests. This stuff can easily consume up to 30% of a workweek but rarely shows up on a project plan.
- Skill Mismatches: Assigning a complex task to a junior team member just because they're "free" can lead to major delays and subpar results. It's a classic trap.
- Lack of Buffer: When you plan your team at 100% capacity, you leave no room for error. There's no space for unexpected issues, creative problem-solving, or urgent last-minute requests.
Moving from reactive assignments to proactive planning is the most significant step you can take to protect your team's well-being and ensure project success. It’s about creating a sustainable pace, not a constant sprint.
This is where proactive capacity planning really changes the game. It’s not some complex theory—it's a practical way to get control. By understanding your team’s true availability, you can align their workload with what's actually possible. If you want to go deeper, our detailed guide on what is capacity planning breaks down the core concepts.
Ultimately, using a dedicated team capacity planning template gives you the structure you need to finally move beyond guesswork. It provides a clear, data-driven view of who is working on what, who has bandwidth, and who is on the fast track to burnout. This visibility empowers you to balance workloads fairly, set deadlines that you can actually hit, and build a more resilient and productive team.
Download And Customize Your Planning Template
Alright, let's move from theory to action. This is where you get your hands on a practical tool that can immediately start improving how you manage your team's workload. We've put together a free team capacity planning template that's clean, easy to use, and available in both Google Sheets and Excel formats.
Grab the version that works best for you and make a copy to get started. Think of this less as a blank spreadsheet and more as a structured framework, ready for you to shape around your team’s unique rhythm.
Getting Your Template Ready
The first move is to turn this template from a generic file into your team's single source of truth for who’s available and when. Customization is everything because no two teams work the same way. Kick things off by listing all your team members in the designated column.
Next, plug in their standard working hours. This might be a simple 40-hour week for most, but it’s crucial to get this right for anyone on a part-time schedule or with different contractual hours. This baseline is the foundation for every calculation that follows.
Now for the most important part of the setup: blocking out all the non-project time. A 40-hour week is never 40 hours of pure, focused project work. You have to account for the realities of the day-to-day grind:
- Public Holidays and PTO: Block out any upcoming vacation days, personal time off, and company-wide holidays.
- Recurring Meetings: Factor in those standing weekly or daily meetings, like sprint planning, team syncs, or one-on-ones.
- Administrative Tasks: Carve out a buffer for general admin, email management, and other routine tasks that are part of the job but aren’t tied to a specific project.
Understanding The Template Structure
To get you comfortable with the layout, let's walk through the key components. Knowing what each part does will make filling it out much faster and more intuitive. Globally, organizations rely on tools like this to accurately forecast their resources, sidestepping the common traps of overbooking or underusing their people. For a deeper dive, check out how Smartsheet explains improving resource management with templates.
Here's a breakdown of the key parts of the template and what they do, helping you get familiar with its structure instantly.
A Quick Look Inside Your Template
| Template Component | What It Does | Example Input |
|---|---|---|
| Resource Name | Lists each individual on your team. | Alex Chen |
| Role/Skill Set | Defines the team member's primary function. | Senior UI/UX Designer |
| Total Weekly Hours | The standard contracted hours for that person. | 40 |
| Non-Project Time | Sum of hours for meetings, PTO, admin, etc. | 8 |
| Individual Capacity (%) | The percentage of time available for project work. | 80% |
| Available Hours | The final, realistic number of hours for tasks. | 32 |
This table gives you a clear map of where to input information and what to expect from the calculations.
The goal isn't just to fill out a spreadsheet. It's to create a realistic, living document that reflects the true bandwidth of your team. This initial setup is the most important step in achieving that clarity.
By capturing these details accurately, you’ll shift from a vague sense of who’s busy to a precise, data-backed view of your team's actual capacity. This lets you assign work with confidence, knowing your plans are grounded in reality. The template is built to do the heavy lifting with the math, so you can focus on making smart, strategic decisions. Once this initial setup is done, you'll have a powerful dashboard ready to help you balance workloads, prevent burnout, and deliver projects more effectively.
How to Calculate Your Team's Actual Capacity
Here’s one of the most common mistakes managers make: assuming a standard 40-hour workweek translates to 40 hours of available project time. It never does. To build a reliable capacity plan, you have to get real about your team's actual capacity—and that means digging into the math of their true availability.
The whole process is pretty straightforward. You'll download the template, tweak it to fit your team's unique rhythm, and then start plugging in your data.
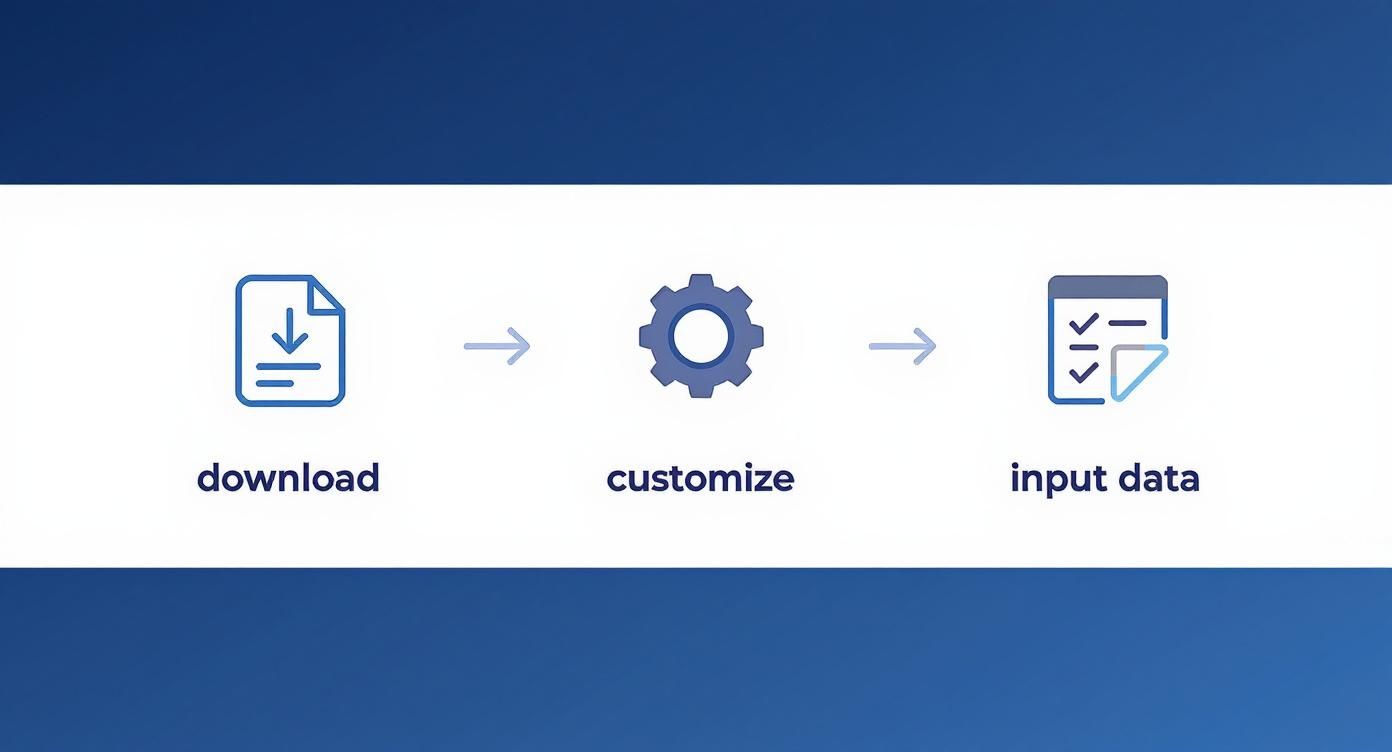
Following these steps grounds your template in reality from the get-go. The secret is to account for everything that pulls people away from their core project tasks.
Moving Beyond Total Hours
First things first, you need to subtract all the non-project time. This is the "invisible work" that quietly eats up a huge chunk of the week but often gets missed in planning. A good template will do this math for you.
Start by listing all those recurring, non-project commitments:
- Recurring Meetings: Think daily stand-ups, weekly syncs, one-on-ones, and any other regular check-ins.
- Administrative Tasks: All the time spent on emails, Slack messages, timesheets, and other general admin stuff.
- Professional Development: Any time set aside for training, workshops, or other skill-building activities.
For example, say a team member has a 40-hour week. If they spend 2 hours in daily syncs, 2 hours in a weekly planning meeting, and around 4 hours on admin, their available project time just dropped from 40 to 32 hours.
Introducing Utilization Rate
Even after subtracting all that non-project time, nobody is 100% productive for every single minute left. Interruptions happen, focus comes and goes, and context-switching takes a toll. That’s where the utilization rate comes in. It’s simply a percentage that reflects how much time a person can realistically spend on focused work.
A healthy and realistic utilization rate is usually somewhere between 70-85%. Pushing for 100% utilization is a recipe for burnout and leaves zero wiggle room for unexpected problems or creative thinking.
Your template should use this formula:
(Total Hours - Non-Project Time) x Utilization Rate = Actual Capacity. This simple calculation is the engine of accurate capacity planning.
This approach acknowledges that true capacity isn't just about hours on the clock—it's about the quality and focus of those hours. For a deeper dive into workforce metrics, check out our guide on how to calculate FTE for better workforce planning.
Customizing Calculations for Different Roles
Not everyone's capacity looks the same. A manager's day is often a whirlwind of meetings and strategy, leaving them with far less hands-on project time than a developer. Your template needs to be flexible enough to reflect these real-world differences.
Think about making role-specific tweaks like these:
- Managers and Team Leads: Their utilization rate for direct project tasks might be as low as 25-40%. Most of their time is spent on team management, mentoring, and talking to stakeholders.
- Senior Developers/Designers: Their time is often split between hands-on work and guiding junior team members, putting their project utilization closer to 60-70%.
- Junior Team Members: They might have a higher utilization rate for project work (around 80-85%), but they also require more supervision, which eats into their manager's capacity.
This level of detail is what makes your plan realistic. It’s a huge challenge—in fact, 90% of leaders see capacity building as a major issue, yet a mere 5% feel their organizations are truly ready to handle it.
To see exactly where your team's capacity stacks up against project demands, using a gap analysis template can be incredibly helpful. When you calculate capacity with this kind of precision, your template stops being a simple spreadsheet and becomes a powerful strategic tool that truly reflects how your team works.
Mapping Projects to Balance Team Workloads

Alright, your template is set up, and you have a solid handle on your team's actual capacity. Now for the fun part: bringing your projects to life within the spreadsheet. This is where it stops being a data-entry tool and becomes your command center, giving you a crystal-clear view of everything on your team's plate.
The idea here is to move past just making a to-do list. We're going to strategically map every task to the right person at the right time.
Start by plugging in all your current and upcoming projects. You'll want to break each one down into its main tasks and, critically, estimate the hours needed for each. Don't rush this part—the more accurate your estimates are, the more you can trust your capacity plan down the line.
A Real-World Scenario: Software Feature Launch
Let's walk through an example to see how this plays out in the real world. Imagine your team is gearing up to launch a new software feature. This kind of project is a classic juggling act, involving designers, developers, and QA testers all working in sequence.
Here’s how you might break down the work in your team capacity planning template:
- UI/UX Design Mockups: Estimated at 40 hours.
- Front-End Development: Estimated at 80 hours.
- Back-End API Integration: Estimated at 60 hours.
- Quality Assurance Testing: Estimated at 30 hours.
As you start assigning these tasks, the template will immediately show you the impact on each person's workload. For example, when you assign the 40-hour design task to your UI/UX designer who has 32 available hours a week, you see right away that they'll be booked for more than a full week on just this one thing.
This instant feedback is what makes the template so powerful. It pulls you out of the world of guesswork and into data-driven decisions. You can spot potential roadblocks and adjust timelines before anyone even starts working.
This process also drags dependencies out into the open. You can see plain as day that front-end development is dead in the water until those design mockups get approved. To keep things moving smoothly, you’ll need good strategies for managing workflow dependencies across teams. Mapping these out visually helps you sequence the work in a way that just makes sense.
Using Visual Cues to Prevent Burnout
A great template doesn't make you hunt for information. It uses simple visual cues, like color-coding, to give you an at-a-glance status report on everyone's plate. This is what turns a static spreadsheet into a living, breathing dashboard.
The color system is usually pretty intuitive:
- Green: This person has plenty of bandwidth (<70% capacity). They might be able to pick up new tasks or help a colleague who's swamped.
- Yellow: They're getting close to full capacity (70-90% capacity). Think twice before assigning them anything new.
- Red: This team member is at or over their limit (>90% capacity). They're at high risk of burnout. Do not assign them more work.
So, when you assign that 80-hour front-end task to a developer, their name might light up in red for the next two weeks. That's your signal—a clear visual warning that they're completely maxed out. It forces you to ask the important questions now, not later: Can we push the deadline? Is there another developer who can pitch in? Can we punt a lower-priority task?
This approach completely flips your planning process from reactive to proactive. Instead of finding out someone is drowning when a deadline slips, you can see the risk weeks in advance and make the right call. It's about balancing the load, protecting your team, and making sure your project timelines are actually based in reality.
Improving Your Forecasts with Real Data
Your team capacity planning template is a fantastic starting point, but let's be honest—it’s just a collection of educated guesses until it meets reality. The real magic happens when you start feeding it actual data from your team's work. A static plan is good, but a dynamic one that learns from your team's performance? That's a game-changer.
This is all about creating a feedback loop. You’ll use real, hard data to make every future forecast a little smarter and a lot more accurate.
The best way to do this is by tapping into your time-tracking tool. When you start looking at historical time reports, you move past guesswork and begin to see how your team really spends its time. This is where you uncover the patterns that matter.
Let's say your team consistently estimates a certain kind of coding task takes 16 hours. But after digging into three months of time-tracking data, you see the average is actually 20 hours—that's a 25% difference. This isn't a sign of bad planning; it's a golden insight. With that knowledge, you can adjust your baseline for similar tasks and instantly make your future timelines more reliable.
Creating a Simple Feedback Loop
The goal here isn’t to create a complex, bureaucratic process. It’s about building a simple, repeatable habit where the time your team actually spends on work directly sharpens your future planning. This cycle—plan, execute, measure, refine—is what separates okay planning from truly great planning.
Here’s a straightforward way to build this loop:
- Track Everything: Get your team into the habit of logging their time accurately against specific projects and tasks. Consistency is everything.
- Review on a Cadence: Set a recurring date—maybe once a month or every quarter—to sit down and compare your template's estimates against the actual hours logged.
- Spot the Differences: Hunt for the big variances. Are certain types of tasks always underestimated? Do particular team members fly through specific kinds of work?
- Update Your Baselines: Use what you've learned to tweak the default estimates in your template for all future projects.
This feedback process transforms your template from a predictive tool into an adaptive one. It learns and evolves right alongside your team, ensuring your capacity plans get sharper over time.
The Role of Analytics in Smarter Planning
Modern tools are making this process even more powerful. In fact, the integration of smarter tech is a key reason why capacity planning is now a standard practice for 72% of project management teams across the globe. They're using analytics and machine learning to get way more accurate with their workload forecasting. You can discover additional insights on capacity planning trends on blog.9cv9.com to see just how deep this goes.
These technologies can surface insights that are almost impossible to spot with the naked eye. For instance, an analytics tool might flag that projects involving cross-departmental work consistently run 15% over their time budget. Now that's an actionable piece of data. It tells you to build a more realistic buffer into similar projects from the get-go.
This all starts with solid data, which is why integrating time tracking into your workflow now is the single most important step you can take.
By fueling your template with real, historical data, you're not just filling out a spreadsheet anymore—you're building an intelligent planning system. This data-driven approach helps you set deadlines you can actually hit, put the right people on the right tasks, and build a whole lot more trust with both your team and your stakeholders.
Common Questions We Hear About Capacity Planning
Even with a perfect team capacity planning template, you're bound to run into a few questions. Rolling out any new process comes with a learning curve, and getting ahead of the common sticking points can make the whole transition smoother for everyone.
Let's walk through some of the questions that almost always come up when managers start getting serious about tracking team capacity.
How Often Should We Update This Thing?
This is probably the number one question. There's no single magic number, but a good rhythm is a quick weekly review. Projects move fast, priorities shift, and a weekly check-in keeps your plan from becoming yesterday's news. It ensures the template remains a reliable source of truth, not just a document you made once.
For a deeper dive, plan a more thorough review monthly or whenever a big new project kicks off. This is your chance to look further down the road, rebalance workloads, and confirm your long-term goals are still achievable. The whole point is for the template to be a living, breathing guide—not a file that collects digital dust.
What’s a Realistic Utilization Rate?
Another big one. It's so tempting to aim for 100% utilization, but take it from me, that’s a one-way ticket to burnout. It leaves absolutely no breathing room for the curveballs that work inevitably throws your way.
A much healthier, and frankly more realistic, target is somewhere between 70-85% capacity.
That buffer isn't just empty space; it's essential for a resilient team. It gives your people the flexibility for:
- Unexpected Tasks: Things like an urgent client request or a surprise bug that needs immediate attention.
- Creative Problem-Solving: The time to actually think through a tough problem instead of just rushing to the first solution.
- Professional Development: Carving out time for learning new skills that ultimately make the entire team stronger.
Planning for less than 100% isn't about being inefficient. It's smart, strategic leadership that builds a sustainable workflow and keeps your best people from burning out.
How Do You Factor in Different Skill Levels?
Finally, managers often ask how to handle the mix of experience levels on a team. An hour of a senior developer's time isn't the same as an hour from a junior team member. If you ignore that, your plan will be off before you even start.
The easiest way to handle this is to build skill levels right into your planning. You can create different categories or just use a simple label (like Junior, Mid-Level, Senior) next to each person's name. This acts as a constant reminder to consider experience when you're estimating how long a task will take.
For instance, you'd assign a highly complex feature to a senior person with confidence. But if you assign a similar challenge to a junior employee, you’d wisely build in some extra buffer time. This kind of nuance makes your team capacity planning template a far more accurate reflection of how your team actually works.
Stop guessing and start planning with confidence. DeskCove gives you the real-time data you need to turn your capacity planning from a chore into a strategic advantage. Start your free trial today.